
Dec 22 The Science of Sea Water Temperature
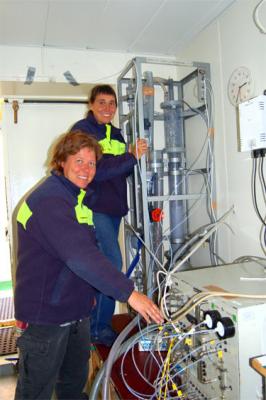
There are several science experiments happening on-board that involve the collection of temperature data at regular intervals along our expedition route. One way this is collected is with the flow-through system that constantly draws samples of seawater through an intake located in the hull of the ship about 8 meters below the surface. This water is brought into the wet-lab on the deck and used not only for temperature analysis, but carbon dioxide, iron, nitrite, nitrate, and plankton analysis with equipment located in the lab. Here is the equipment Swedish scientists Agneta Fransson and Melissa Chierici are using to study carbon dioxide concentrations.
But in terms of temperature – some of the really interesting information is what is happening beneath the surface. Kevin Pedigo, a technician for Raytheon Polar Services, is on-board to conduct a couple of different experiments that will study what happens underneath.
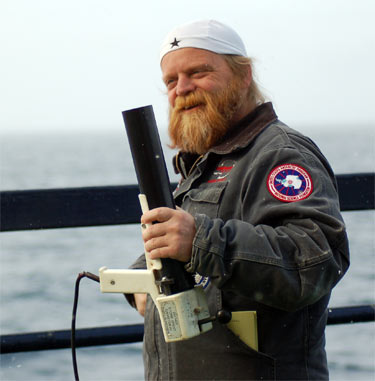
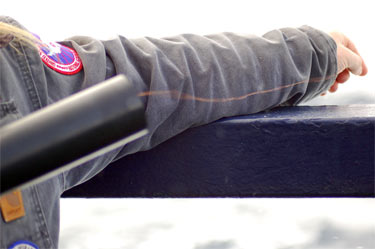
It’s been exciting to be able to assist with these experiments and I thought it might be interesting to share a bit of the process and results so far. This is a photo of an XBT – an expendable below-surface thermocouple.
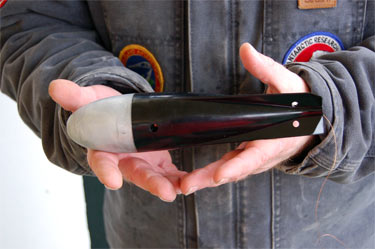
It is basically a weighted thermometer that sends temperature data back to a computer through a thin copper wire as it descends to depths of up to 900 meters. We launch one of these every two hours and end up with a profile of the ocean temperatures along our path. Here is Kevin launching one over the side of the Oden.
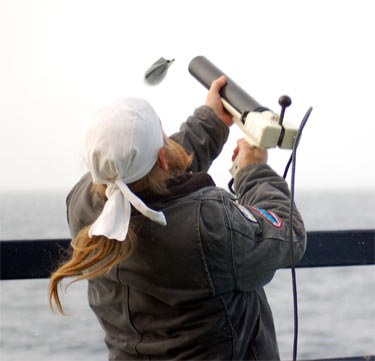
If you look closely – you can see the thin copperwire that carries the data from the XBT as it descends back to a computer located in a workroom on the main deck.
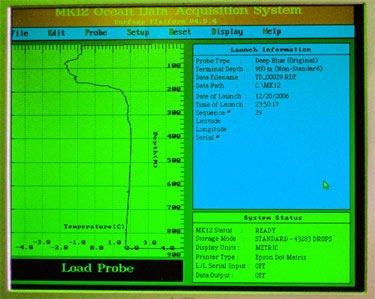
Here is a picture of the graph that is made with the data as it is received from the XBT as it descends - there is only 900 meters of wire connected to the thermocouple so once the end is reached the wire snaps and the data stream is ended.
If we zoom in a bit on the graph – you can see some of the interesting data that the XBT allows scientists to explore in regards to the temperatures under the surface of the Antarctic Ocean. For instance – notice that in the first 10 meters the water temperature is warm but then drops rapidly reaching its lowest temperature at 80 meters and then warms steadily down to a depth of 200 meters after which it holds fairly constant down to the last reading from the probe.
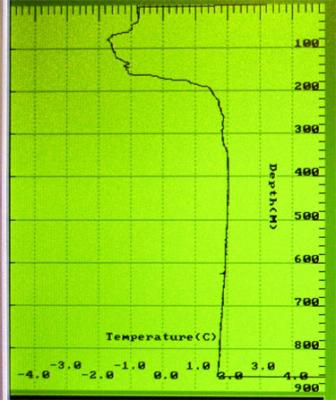
One phenomena of sea water is that it is densest at about 1.8 degrees celcius – which explains why this is the temperature of the deep layers, with the less dense, but colder waters on top. There is also likely a difference in the salinity of these various layers – as sea ice forms a dense brine solution (salt that is pushed out of the ice structure) that also sinks under – as well as melting ice adding less dense fresh water to the surface layers.
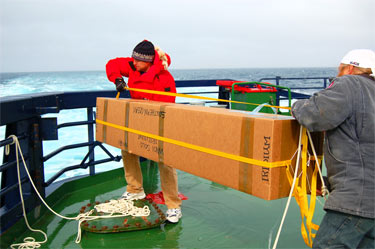
In order to really understand these layers that are seen in the temperature data – another probe is used which is capable of collecting both temperature and salinity data – a device called the SOLO. Here is a picture of the probe on deck, being prepped by Raytheon Polar Services technician Cooper Guest.
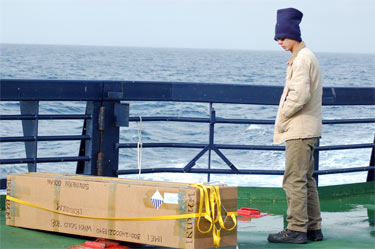
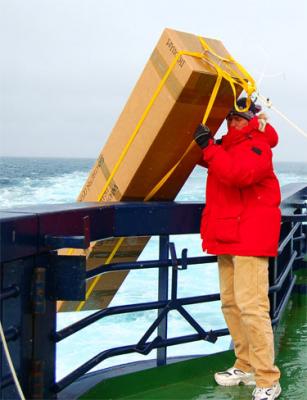
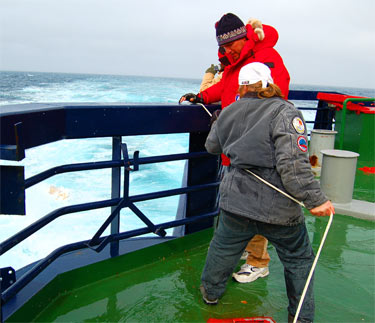
Our expedition will launch a total of 6 of these, spread out at various latitude lines in order to record profiles of temperature and salinity down to approximately 1800 meters. Weighing about 40 kilograms each, it takes a couple of us to lift them over the stern rail and lower them gently into the water. Here Kevin and I launch one at 67 degrees south latitude.
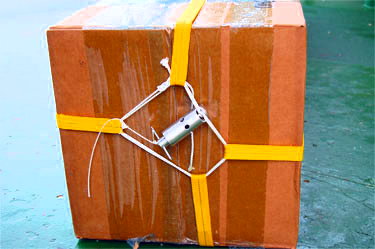
Once it is afloat in the ocean, then an ingenious little bracket allows it to be released and the rope and strapping recovered for the next release. The metal bracket contains cornstarch which holds it together – which dissolves within a few seconds of being submerged in the water and releases the bracket. Here’s a shot of the bracket before we launched the SOLO.
A much more sophisticated probe then an XBT, the SOLO descends to a depth of 1800 meters while recording both temperature and salinity data, then ascends to the surface using compressed gas for buoyancy and utilizes an iridium satellite phone signal to its data back to researcher Breck Owens at Woods Hole Oceanographic Institute.
After it sends its initial data, the float descends to a depth of 1000 m, drifts for about 9 days, then descends to 1800 meter and again records salinity and temperature data while it ascends back to the surface. It sends off the data including gps coordinates, then continues this descending / ascending cycle until the batteries expire in about 4 to 5 years.
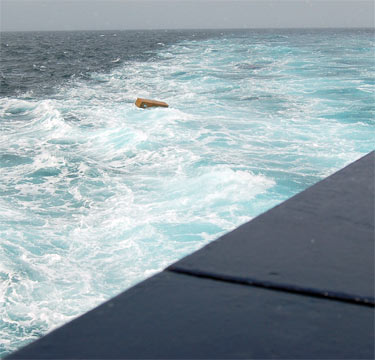
These probes will provide a tremendous amount of information – both about the temperature and salinity profiles, but also about the Antarctic currents that move them about. It is very exciting to have been part of the launch of this project with Kevin and Cooper. Here is our final view of the SOLO as it began to sink into the sea to begin its work. We’ll launch one more tonight as we approach the edge of the pack ice near the Ross Sea and then the project will run itself transmitting data for the next five years.
Comments