Welcome to the Virtual Base Camp, the starting point for your exploration of the polar regions with PolarTREC teachers and researchers!

2017 Expedition Timeline

Expeditions

Operation IceBridge 2017

Operation IceBridge 2017
Dates
-
Location
Kangerlussuaq, Thule AFB, Greenland

What Are They Doing?

Photo by Russell Hood
Icebergs the size of a city block in eastern Greenland. Photo by Russell Hood.
IceBridge is in its 8th year as a NASA mission and is the largest airborne survey of Earth's polar ice ever conducted. IceBridge uses a highly specialized fleet of research aircraft and the most sophisticated science instruments ever assembled to characterize yearly changes in thickness of sea ice, glaciers, and ice sheets in the Arctic and Antarctic. The research team is experiencing first-hand the excitement of flying a large research aircraft over the Greenland Ice Sheet. While in the air they are recording data on the thickness, depth, and movement of ice features, resulting in an unprecedented three-dimensional view of ice sheets, ice shelves, and sea ice. Operation IceBridge began in 2009 to bridge the gap in data collection after NASA's ICESat satellite stopped functioning and when the ICESat-2 satellite becomes operational , making IceBridge critical for ensuring a continuous series of observations of polar ice. IceBridge flies over the Arctic and Antarctic every year - in the Arctic from March to May and the Antarctic in October and November. By comparing the year-to-year readings of ice thickness and movement both on land and on the sea, scientists can look at the behavior of the rapidly changing features of the polar ice and learn more about the trends that could affect sea-level rise and climate around the globe. Support for a teacher on this project is provided through separate funding to ARCUS through NASA. More information about IceBridge can be found at the NASA project website.

Adeena Teres
Teacher
Stoneman Douglas High School

Parkland, FL
United States

Expedition Map

Arctic Ground Squirrel Studies 2017

Arctic Ground Squirrel Studies 2017
Dates
-
Location
Toolik Field Station, Alaska

What Are They Doing?

Photo by Andre Wille
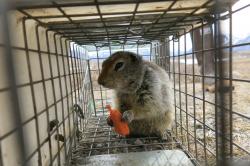
An Arctic ground squirrel eating a carrot in a cage. Photo by Andre Wille.
The climate of the Arctic is extreme and characterized by long dark cold winters and short bright cool summers. Arctic ground squirrels avoid the long winters by spending 7-9 months below-ground hibernating, reaching body temperatures as low as -3°C as they supercool their tissues. But the onset of spring in the Arctic can be variable depending on the depth of the winter snowpack that needs to melt and the prevalence of late spring snowstorms. How do arctic ground squirrels know when to terminate hibernation and emerge to the surface?

Predicting how species might alter their annual timing in response to rapid environmental change, including climate change, is constrained by insufficient knowledge of the endogenous mechanisms animals use to keep time, the cues used to adjust timing, and the extent to which programmed seasonal cycles are physiologically plastic. This study will investigate the mechanisms that underlie plasticity in the seasonal induction of the neuroendocrine signals that trigger the termination of hibernation and onset of reproduction in ground squirrels.

Jennifer Baldacci
Teacher
International School of Basel

Basel
Switzerland

Expedition Map

Dynamic Observations of the Microstructural Evolution of Firn

Dynamic Observations of the Microstructural Evolution of Firn
Dates
-
Location
Summit Station, Greenland

What Are They Doing?

Photo by Jim Pottinger
An ice core from a coring machine in Greenland. Photo by Jim Pottinger.
There is broad interest in understanding firn compaction for a number of reasons, most importantly for better interpretation of paleoclimate from air that becomes trapped within the firn (granular snow, especially on the upper part of a glacier, where it has not yet been compressed into ice). Firn densification involves a number of different mechanisms which leads to vapor movement. We will determine the mechanisms of firn densification and microstructural evolution as a function of depth using dynamic observations of the evolution of the firn using X-ray computed microtomography (µCT).

We will drill an 80-meter firn core at Summit, Greenland and transport it to Dartmouth University. After the field expedition, Steve will work with the team at the university, where we will perform experiments to observe changes based on temperature and stress (due to depth and load). In addition to observing the microstructure as a whole, we can follow the evolution of ice crystals to observe bond formation and bond-breaking under load in detail, as undertaken in some prior studies on snow.

Our project will aid in the understanding of firn and ice microstructure evolution in polar ice sheets. This will aid in understanding ice flow and interpreting paleoclimate reconstruction from ice cores.

Steve Kirsche
Teacher
Liberty Pines Academy

St. Johns, FL
United States

Expedition Map

Jellyfish in the Bering Sea

Jellyfish in the Bering Sea
Dates
-
Location
R/V Oceanus, Eastern Bering Sea

What Are They Doing?

Photo by Misty Nikula-Ohlsen
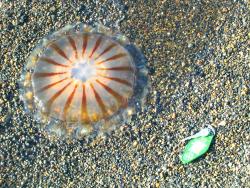
A jellyfish on the beach near Barrow, Alaska. Photo by Misty Nikula-Ohlsen.
There is public perception that jellyfish populations are increasing on a global scale. While this may be true for some areas, in the eastern Bering Sea, jellyfish populations have fluctuated dramatically during the past three decades.

This project will estimate the age structure and age-specific abundances of the predominant jellyfish in the Bering Sea, Chrysaora melanaster, in order to understand how their population size changes with time. The ultimate goal is to estimate the reproductive capacity and success of this jellyfish in relation to climate variability and to investigate the potential for jellyfish population increases to become a recurring pattern in the Bering Sea under future climate scenarios. In the Bering Sea ecosystem, key questions are whether increases in jellyfish abundance are a recurring phenomenon under climate change and fishing pressure and how these population increases affect ecosystem structure.

Lenore Teevan
Teacher
Booker T. Washington High School

Norfolk, VA
United States

Expedition Map

Research Opportunities in the Arctic for Minorities

Research Opportunities in the Arctic for Minorities
Dates
-
Location
Utqiaġvik, Alaska

What Are They Doing?

Photo by Cristina Solis
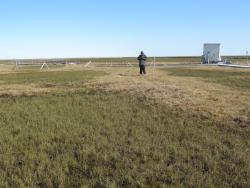
Grassy tundra in Barrow, Alaska. Photo by Cristina Solis.
Using legacy and modern data for the Utqiaġvik (formerly Barrow), Alaska area, together with field experiences and lab-based manipulations, the ROAM2 program will orchestrate authentic, collaborative research experiences, where undergraduate students from the University of Texas at El Paso (UTEP) will develop research questions, collect, analyze, and synthesize data, and communicate results in scientifically valid venues on topics in Arctic ecosystem ecology. These experiments will be completed using tundra soil monoliths and cores that we have brought back from Utqiaġvik, Alaska. PolarTREC teacher Ruth Rodriguez will implement a similar student project in her classroom.

UTEP is one of the nation’s leading Hispanic Serving Institutions and is situated in a region where 80% of the population is Hispanic. This program aims to make a significant impact on the polar student demographic by not only offering direct training, but also familiarizing them with national challenges in minority education and advancement.

Ruth Rodriguez
Teacher
Clint ISD Early College Academy

Clint, TX
United States

Expedition Map

Arctic Glacial Lakes

Arctic Glacial Lakes
Dates
-
Location
G. William Holmes Research Station at Lake Peters, Alaska

What Are They Doing?

Photo by Dan Frost
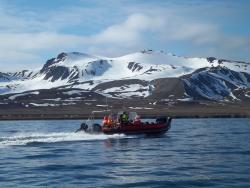
Lake Linné, Svalbard is the site of a previous year's research. Photo by Dan Frost.
This project seeks to better understand the natural variability of hydrology and sediment transport in Arctic glacial lake systems, and to investigate how this variability might be impacted by climate change in the future. Studies such as this one, which captures natural variability across the Arctic at different temporal scales, are necessary to enhance our comprehension of how climate change has impacted and will continue to impact these systems.

In order to improve our paleoclimate reconstructions of these processes, a crucial step is the development of a system model that describes the hydrology, sediment-flux, and sedimentation in glacial lake systems. A main goal of this project is to establish such a model, and to apply it to three glaciated watersheds that span a gradient from the sub-Arctic to high Arctic. The three lakes included in the study are Eklutna Lake (a sub-arctic lake near Anchorage, Alaska), Lake Peters (in the Arctic National Wildlife Refuge, Alaska), and Lake Linné (Svalbard, in the high Arctic). From 2015-2017, field seasons have focused on Lake Peters, where weather stations, sediment traps, ablation stakes, and various other climate monitoring has continued for a total of three years, and sediment cores have been collected to reconstruct paleoenvironmental changes.

Rebecca Harris
Teacher
Escalante High School

Boulder, UT
United States

Expedition Map

Upwelling and Ecology in the Beaufort Sea

Upwelling and Ecology in the Beaufort Sea
Dates
-
Location
R/V Sikuliaq, Beaufort Sea

What Are They Doing?

Photo by Lisa Seff
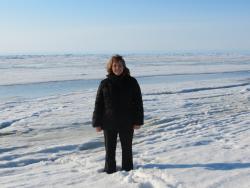
Lisa stands on sea ice near Barrow, Alaska. Photo by Lisa Seff.
The Beaufort Sea shelf break experiences frequent upwelling of deep, nutrient rich basin water onto the shelf. Such upwelling is not only a short-term source of heat, salt, and nutrients, and a mechanism promoting elevated primary production, but it also transports populations between ocean regions, potentially modifying ecosystem structure and availability of zooplankton and fish prey to upper trophic level consumers. The Beaufort Sea shelf break is a domain of enhanced abundance of upper trophic level animals, presumably in response to elevated availability of their prey.

The team plans to explore and identify the mechanisms linking broad-scale atmospheric forcing, ocean physical response, prey-base condition and distribution, upper trophic level animal aggregations, and climate change along the Beaufort Shelf break. The team's overarching hypothesis is that atmospherically-forced (wind-induced) upwelling along this shelf break leads to enhanced feeding opportunities for intermediate links in the pelagic ecosystem (zooplankton, forage fish) that in turn sustain the exploitation of this environment by animals such as beluga whales, seabirds, and seals. Support for the teacher is provided through the research project funding.

Lisa Seff
Teacher
Springs School

East Hampton, NY
United States

Expedition Map

CO2 and pH Studies of the Arctic Ocean

CO2 and pH Studies of the Arctic Ocean
Dates
-
Location
CCGS Louis S. St-Laurent, Beaufort Sea

What Are They Doing?

Photo by Bill Schmoker
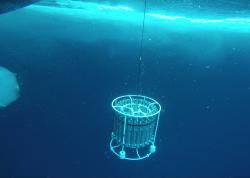
An underwater view of a CTD (conductivity, temperature, and depth instrument). Photo by Bill Schmoker.
Global warming and other climate-related processes are rapidly changing the Arctic Ocean. The carbon cycle is of particular concern in the Arctic because it is unknown how carbon sources and sinks will change and whether these changes will lead to increased greenhouse gas accumulation in the atmosphere. Not much is known about the CO2 cycle in the central Arctic Ocean basins because nearly all measurements have been focused on the Arctic coasts during the low ice summer period. The team's contribution will be to collect shipboard CO2 data during these cruises and deploy CO2, pH and oxygen sensors on existing moorings in collaboration with Woods Hole Oceanographic Institution scientist Rick Krishfield.

The Arctic Ocean is changing rapidly. The changes have important implications for global carbon cycling, global fisheries and ocean acidification. There are many intertwining processes, however, that make future predictions difficult. This project will make important contributions to our understanding of the global carbon cycle and ocean acidification by providing Arctic scientists with high quality carbon cycle data to use in model development and as a baseline for comparison with future carbon parameter measurements.

Dave Jones
Teacher
Big Sky High School

Missoula, MT
United States

Expedition Map

Seasonal Sea Ice Production in the Ross Sea

Seasonal Sea Ice Production in the Ross Sea
Dates
-
Location
McMurdo Station, Antarctica

What Are They Doing?

Photo by Lollie Garay
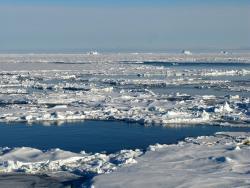
Sea ice in the the Ross Sea. Photo by Lollie Garay.
In situ measurements and airborne surveys of snow depth and sea ice thickness are key for improving estimates of sea ice production and water mass transformation in the Ross Sea. The principle objective of this scientific expedition based on McMurdo Station is part of the PIPERS: Polynyas and Ice Production in the Ross Sea, project to fully capture the space/time evolution of the air-sea-ice interactions initiated during autumn and tracked into winter/spring in the Ross Sea. This project will collaborate with a New Zealand team to measure snow and ice thickness of the fast ice in McMurdo Sound, for validation of sea ice thickness imaged from airborne IcePod’s Shallow Ice Sounding Radar, and also mapping pack ice thickness and types from IcePod’s lidar, visible and thermal cameras. These data will be compared with ice thickness measurements from NASA’s IceBridge mission in the Ross Sea to extend the sea ice thickness measurements in this region to multi-years. PolarTREC teacher Jennifer Bault will be a full participant in sampling and conducting geophysical field measurements of the snow and ice, with a possibility to get onto IcePod flights to watch the scientific data collections from different types of sensors onboard IcePod.

More information about the PIPERS project and a cruise blog can be found here.

PIPERS Logo
PIPERS logo

Jennifer Bault
Teacher
Nicolet Union High School

Glendale, WI
United States

Expedition Map

Antarctic Automatic Weather Stations

Antarctic Automatic Weather Stations
Dates
-
Location
McMurdo Station

What Are They Doing?

Photo by Elin McIlhattan
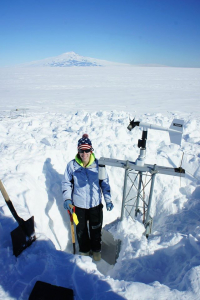
Carol Costanza helps recover Laurie II AWS. Photo by Elin McIlhattan
The Antarctic Automatic Weather Station (AWS) network has been making meteorological observations since the early 1980s. This continent-wide network is positioned to observe significant meteorological events and increase our understanding of the climate of the Antarctic surface. Researchers utilize the AWS network to observe and learn about the Antarctic in a warming world. Given the duration of the AWS program and maintaining AWS sites for many years, numerous studies have been conducted on the surface climatology of regions of the continent, such as the Ross Ice Shelf. This climatology also aids in other studies, like winter warming events.

The Antarctic Automatic Weather Station network provides a greater understanding of the surface meteorology and climatology throughout the continent of Antarctica. The AWS network spans the Ross Ice Shelf, Ross Island, West Antarctica, East Antarctica, and the South Pole. Since some of the AWS have been working for over 30 years, we can begin to understand the climate over many regions of Antarctica.

George Hademenos
Teacher
Richardson High School

Richardson, TX
United States

Expedition Map

IceCube and the Askaryan Radio Array

IceCube and the Askaryan Radio Array
Dates
-
Location
South Pole, Antarctica

What Are They Doing?

Photo by Jim Haugen
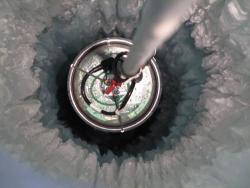
A DOM (Digital Optical Module) being lowered into the ice. Photo by Jim Haugen.
Why go to the bottom of the world to explore the universe? Because it is a nearly ideal place to study one of the most elusive particles known, the almost massless subatomic messenger called the neutrino. The IceCube Neutrino Observatory at the South Pole searches for neutrinos from the most powerful astrophysical sources: events like exploding stars and extreme environments around black holes and neutron stars. This requires a large detector, and IceCube is the largest detector by volume ever built, encompassing a cubic kilometer of instrumented ice. That much ice weighs more than all the people in the world!

The fully built Askaryan Radio Array (ARA) project will have an effective volume 100 times larger than IceCube. The tradeoff is that it will only be capable of observing radio waves from interactions with extremely high energy neutrinos, a million times more energetic than the neutrinos produced by cosmic rays in the atmosphere. IceCube studies those lower energy atmospheric neutrinos, 100,000 per year, to learn more about neutrino properties, including their ability to transform from one type to another.

The universe is a huge and mysterious place that is largely unexplored. New technologies and creative approaches allow us to see things that aren’t directly viewable. Neutrinos will reveal new information about the Universe that can’t be recorded with optical or even more exotic telescopes that measure other types of light, like radio waves, microwaves, x-rays, and gamma rays. Many different roles and talents are needed to develop new approaches—technicians to make and operate new machines, computer experts to store and retrieve data, and scientists to define goals, identify promising projects, and guide students. IceCube and ARA are discovery instruments that will lead to a greater understanding of the cosmos and will hopefully uncover new mysteries for scientists to solve.

Lesley Anderson
Teacher
High Tech High Chula Vista

Chula Vista, CA
United States

Expedition Map