Once each core sample was split, a host of descriptions, tests and sampling protocols awaited the mud inside. To keep organized, a sampling plan was mapped out for each core taken in US waters on our cruise (Canadian-side samples will undergo similar analysis early next year in Nova Scotia.) On the sampling plan, each core section is shown with its assigned International Geo Sample Number (IGSN, which works like a trackable serial number) and the places where each core was trimmed (in centimeters, measured from the top.) From these measurements the length of each trimmed section can also be easily determined. The map also indicates samples taken from the core catcher & core cutter, as well as external sediment scrapes analyzed for microfossils. Blue dots show the plan for pore water sampling via rhizon (more on this later), and the red & brown bars show where ~50 gram samples are to be taken for later sediment gas analysis (adsorbed gas sticks to grains, while free gas is within the spaces between sediment grains.)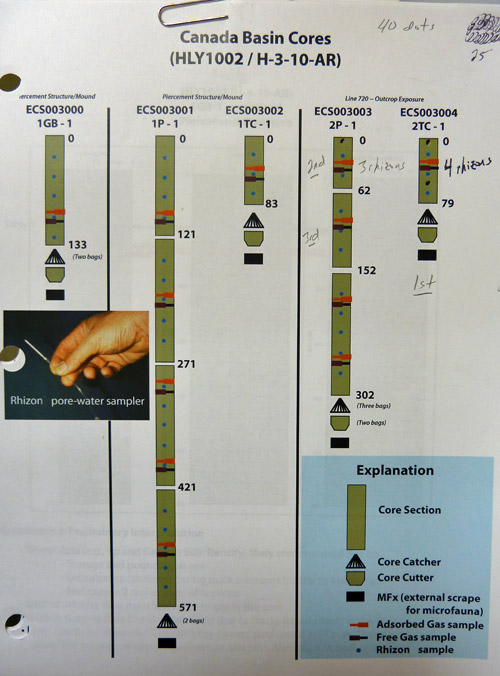
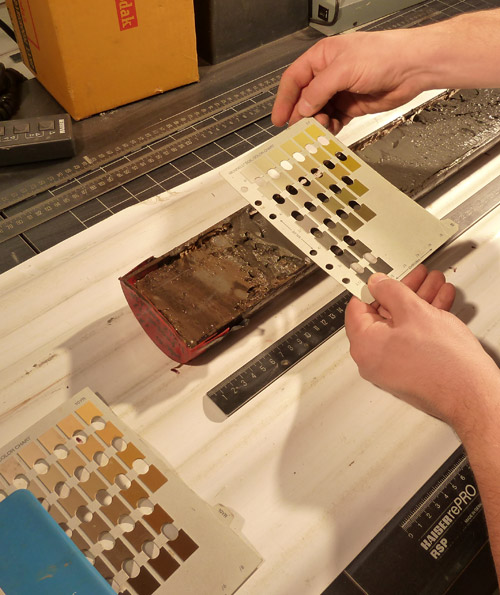
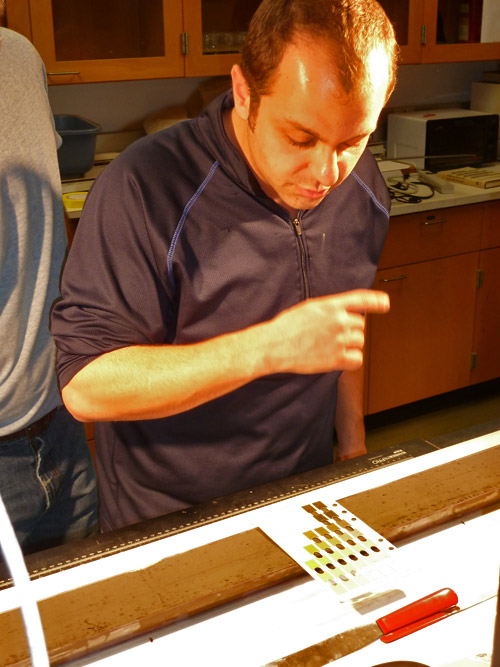
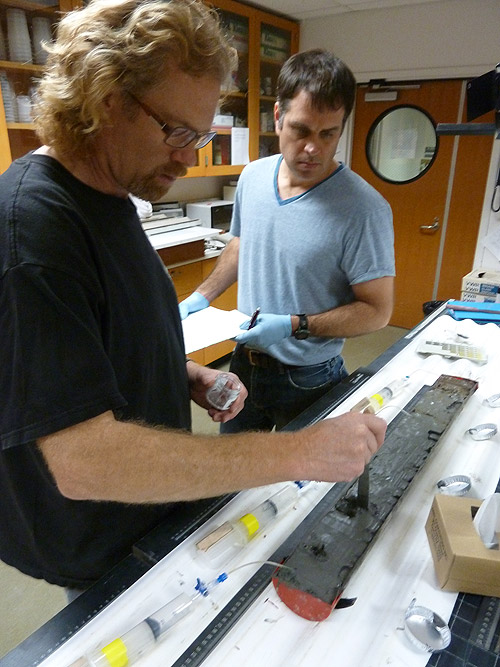
Before any samples are taken from the working half, a thorough description of the core section is entered into the database. Many senses are involved. For color description, standard soil-classification color cards are used to find the best match. Values for hue, value, & chroma are recorded according to the Munsell color system. High-intensity lamps that produce full-sunlight spectra are used to determine true daylight color. Sediment size is also determined, partially by looking closely at each layer with a hand lens and grain size comparison charts. But even with a good hand lens, silt-sized grains (smaller than fine sand, < 0.05mm) can be very difficult to see. Here geologists employ their sense of touch, trying to see if they can feel any gritty silt in the sample on their hands, fingers, or even teeth (which are more sensitive to grittiness than skin.) In comparison, clay particles are very smooth and slippery feeling. Even the sense of smell is important, as distinctive odors can indicate different components within a core sample. We were particularly interested in the presence of hydrogen sulfide, which has a tell-tale rotten egg smell. On some core sections, fall cone tests were conducted to see how solid the sediment was (the cone, with a known weight and angle, penetrates farther into softer sediments.) Patches of sand-sized grains were tested to see if they contained calcium carbonate with a simple acid test. These descriptions, along with the high-resolution core photographs, can be used by future researchers working on the material.
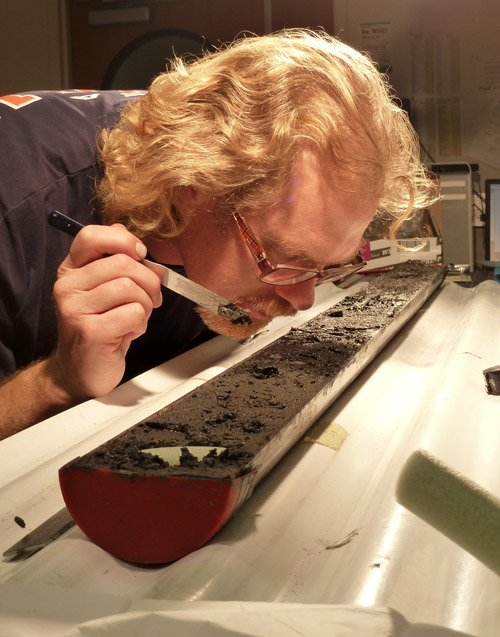
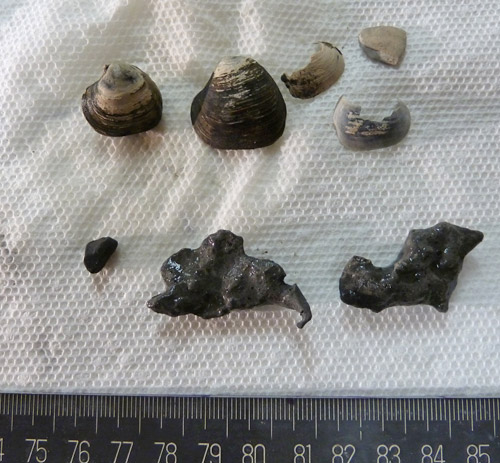
When thoroughly described, samples are taken from the working section. Scoops of 50 grams or so are taken at intervals for later geochemical analysis of adsorbed and free gas. Rhizons are inserted to collect pore water (the water between grains.) Later geochemical analysis of this water can reveal much about the movement and origin of compounds such as methane and hydrogen sulfide. These two substances have potentially major implications for deepwater life in the Arctic- more on this later, too!! At each rhizon site a few grams of sediment is collected and weighed wet. It is then put into a drying oven overnight and re-weighed, with the difference noted to calculate the sample's total water content. Blackish authogenic carbonate nodules (which form in place, locking in organic & inorganic carbon present at the time) and shell material is collected for later isotopic analysis and classification when present.

Here's a short video I put together showing some of the processes of sea floor core analysis in action!
http://
That's all for now- Bill


Comments