The PolarTREC Field Experience
PolarTREC (Teachers and Researchers Exploring and Collaborating) is a program funded by the National Science Foundation that partners K-12 teachers in the United States with scientists doing research in polar regions. The goal of the program is for teachers to be authentically integrated into scientific expeditions in order to gain new skills and experiences that they can bring back to the classroom, and for scientists to have support translating their research into language and ideas that are accessible to the general public. I received notification that I had been accepted into the PolarTREC program at the end of December 2018 and then had to wait more than a year for my expedition to the Thwaites Glacier in Antarctica to begin in January of 2020. During that time, I attended a PolarTREC orientation, prepared myself, my students, and my classroom for my two-month absence, and read as much as I could about Thwaites, a Florida-sized glacier draining into the Amundsen Sea that is often referred to in the popular press as “The Most Dangerous Glacier in the World.” As family, friends, students and colleagues learned of my upcoming adventure, many of them said, “I had never heard of Thwaites before and now I realize they are talking about it in the news all the time!” To me, this is just one small example of the exceptionally broad impact a PolarTREC experience can have- it affects not just the educator, but their entire community- people in my community became deeply invested in my expedition and gained greater awareness of the impact of warming temperatures on the stability of Thwaites Glacier- in some cases long before I left on my journey.
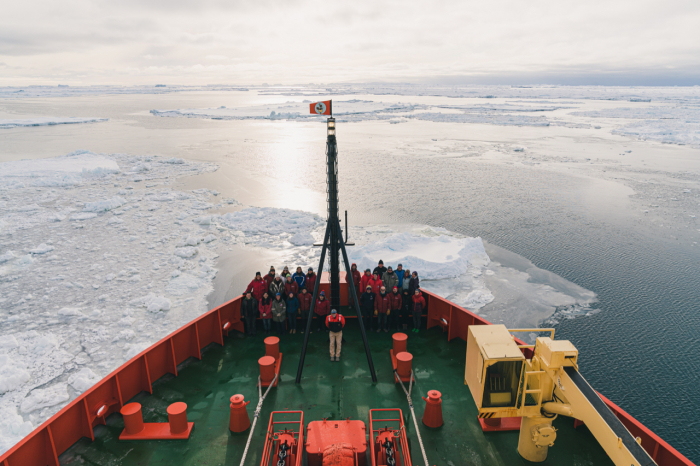
The Big Picture - Why Thwaites Glacier Matters
The continent of Antarctica is divided into two regions by the Transantarctic Mountains. The East Antarctic Ice Sheet is much larger and is covered in ice that is almost three miles (5 kilometers) thick. It is far more stable than the West Antarctic Ice Sheet, which is where Thwaites Glacier and its neighbor the Pine Island Glacier (PIG) are located. Satellite imagery has shown that the melt rate of Thwaites has doubled over the past 30 years and scientists fear that rate is poised to increase even further. There are multiple factors that contribute to the phenomena of more rapid melting in West Antarctica. Global water currents and wind patterns that move heat towards the western side of the continent have monumentally significant impacts. Thwaites and PIG both terminate in ice shelves that jut out into and float on the ocean. When ice shelves break apart (as happened early in 2020 at PIG), there is no immediate change in sea level because the ice shelf was already floating in the water. But the deterioration of the ice shelf means that more ice from the glacier can flow in to take its place, thereby increasing the rate at which ice is moved from the land to the sea. The point where the ice of a glacier leaves the land and begins to float is the grounding line, and it is one of the most important features to scientists studying how glaciers melt.
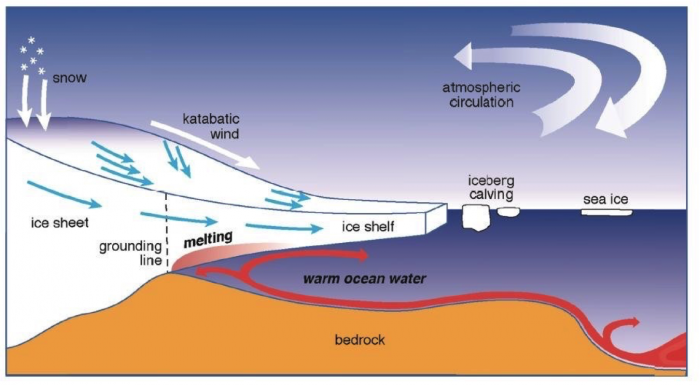
Behind the grounding line of Thwaites, the bedrock slopes down- so the warm water is melting more ice near the grounding line than is flowing from upstream of the glacier. This results in the glacier thinning at the grounding line and causes the grounding line to retreat. If the grounding line retreats over bedrock that is becoming deeper (dipping landward), then more of the glacier front will be exposed to the water, which will further increase the melting, which leads to a faster retreat of the grounding line- a positive feedback loop that is destabilizing Thwaites Glacier. If Thwaites were to catastrophically collapse, global sea level would rise by an estimated two feet. Additionally, Thwaites acts as a backstop for a number of other West Antarctic glaciers- without Thwaites there to hold them in place, these glaciers could also rapidly flow towards the Southern Ocean, and if all of them were to melt as well, it could potentially contribute an additional thirteen feet to global sea-level rise.
The International Thwaites Glacier Collaboration (ITGC), a partnership forged between the US and the UK, involves eight different projects, all focused on developing a better understanding of Thwaites Glacier - and each of the eight projects approaches the challenge of the glacier from a different angle - both literally and figuratively. Scientists have been on top of the glacier boring holes down to the sediments underneath, satellites orbiting miles above the surface have captured images that show the thickness and movement of the ice, data, and images have been used to improve ice sheet models to better predict the future behavior of Thwaites, and the Nathaniel B. Palmer icebreaker has carried researchers right up to its face to study the interaction between the ice and the ocean. Each of the eight projects involves multiple scientists at various research institutions, all of who bring different strengths, knowledge, and technology to the fight to figure out what Thwaites is going to do over the next ten or fifty or one hundred years to change the shape of human civilization.
The Science of the Ship
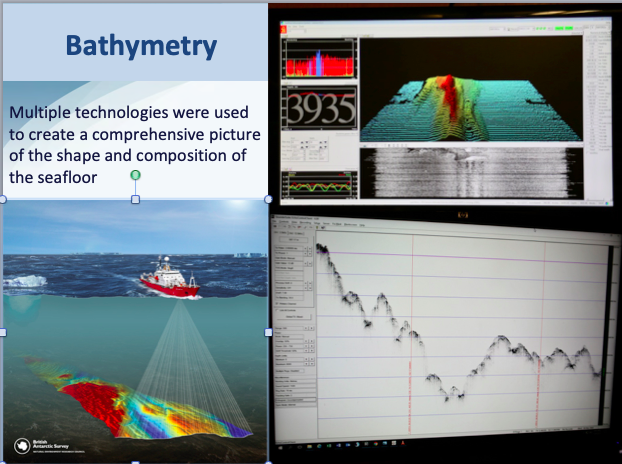
Bathymetry: Bathymetry, or the study of the shape of the seafloor, is used to create a more thorough picture of why the Thwaites Glacier is melting so fast. Much of the work we accomplished on this expedition was focused on improving the level of detail of maps of the seafloor in the area in front of Thwaites.
Sediment: Over tens or hundreds or thousands of years, new layers of sediment are deposited, and can reveal information about the position of the glacier, the temperature of the water, or rate at which ice was melting at the time they drifted to the seafloor. We used four different types of coring devices that each had different advantages: the Kasten core, the Megacore, the jumbo piston core, and the box core.
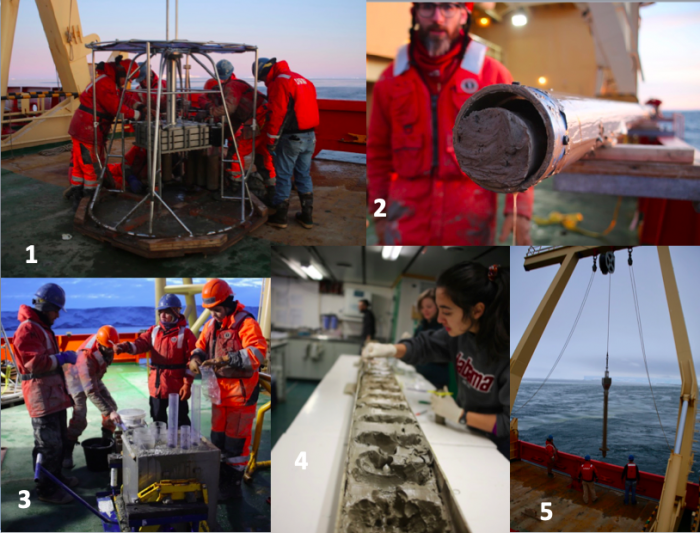
The Kasten corer was deployed over 30 times throughout the duration of our expedition. With a three-meter long square barrel with giant weights sitting on top, the Kasten core sinks into the sediments using its own weight. The full Kasten core is brought back up to the deck using a winch, rinsed off, carried into the lab, and opened to reveal the sediments captured. Almost-invisible changes in color, texture, and composition of the sediments over the length of the core were documented in writing and in photos and by targeted sediment collection. Sediments are sampled for many things, including: shear strength, species of foraminifera, grain size, trace metals, carbon and nitrogen, diatoms, and lead-210. Unlike the Kasten core, which is a single 3-meter long barrel, the Megacore has 12 short tubes. Each tube has the potential to capture up to 60 cm of water and sediment right at the seafloor- many of the researchers were interested in studying that sediment-water interface. Rarely did we get twelve perfect tubes of sediment, so decisions were made on how to parcel out the samples that were collected. Megacore samples were processed on the ship by slicing off one centimeter of sediment at a time and placing each slice in its own baggie. We occasionally used the jumbo piston corer, which has the capacity to drive up to 80 feet into the sediments (although we commonly used it for lengths of about half that). The JPC carries significant weight so it often blows out the soft sediments at the surface, but can get a record much longer, and thus older, than the other coring devices. Lastly, we only deployed a box core a few times, after using other types of coring devices to identify areas with high value surface sediments. The box core collected a one cubic meter of sediment from the seafloor, which was then divided up into subsamples that generally provided a high quality picture of the topmost layers of sediments. The majority of sediment samples were sealed in ziplock bags and brought to researchers home institutions for complete analysis.
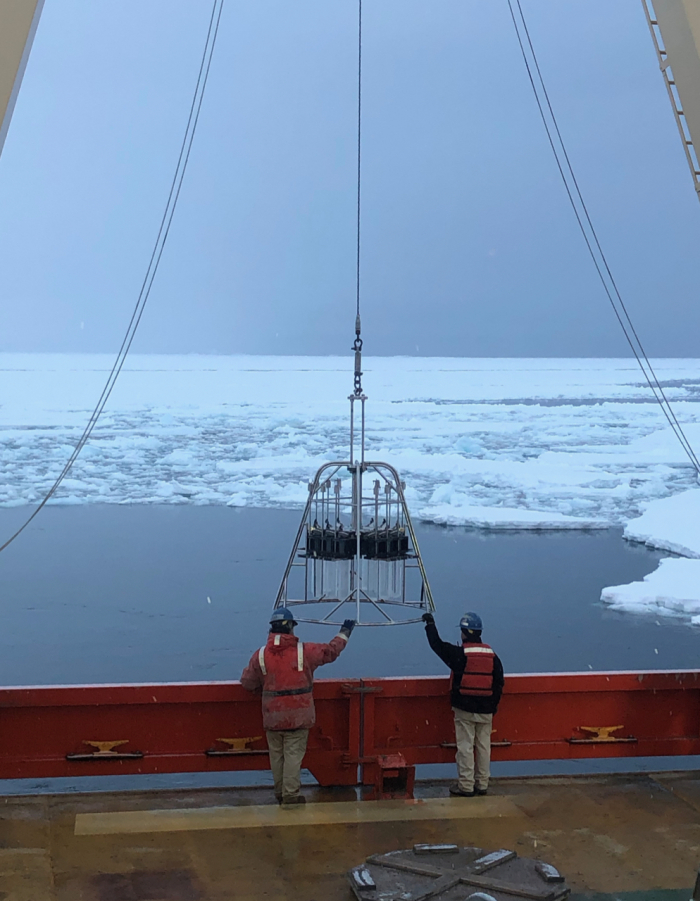
Oceanography: There are various techniques for sampling water chemistry, some designed to capture information over an extended period of time and some over a variety of locations and some a combination of both. There were also samplers that provided real-time or close to real-time data, and others that only returned their information to the researcher when they were retrieved from their sampling location. The THOR project, with its focus on sediment sampling and bathymetry, had the majority of the science hours on the NBP during the cruise, but we did complete multiple CTD transects, deploy and then attempt to collect two gliders (only one was successfully recovered), launch six floats as part of the Southern Ocean Carbon and Climate Modeling program, deploy two moorings which will collect data in a single location for multiple years, and place data trackers on twelve seals, which will send back water chemistry information every time they surface over the next year. Information collected by these devices can show the presence of the Circumpolar Deep Water (average temperature of our CDW samples was just over 1˚C) that has the potential to cause extensive melting of the Thwaites Glacier from below. Oceanographic data collected further out from Thwaites can reveal patterns in water temperature and salinity that can reveal how and why the Southern Ocean’s currents are moving and shifting.

The Value of Teachers on Science Expeditions
One of the most essential qualities of an effective teacher is the ability to figure out how to help students discover new information. By identifying engaging phenomena, designing inquiry-based learning experiences, and supporting students as they communicate their understanding, teachers can guide children through the acquisition of novel ideas. That ability to frame facts and data in an intriguing and easily-accessible package can also make a teacher an invaluable asset in a scientific research program. Teachers can translate technical work into information for a non-technical audience, and help build a broader understanding of the importance of research efforts and the meaning of results. In the case of polar research, teachers can also use the experience to identify additional pathways to engage students in thinking about the impact of a changing climate on environments both near and far. And, for students, having the personal connection of a teacher they know involved in the research effort can make them further invested in developing a better understanding of complex ideas and difficult data.
Connecting to my Classroom and Community
I wanted to connect with a range of audiences through my journal and other outreach efforts. My middle school students were always at the forefront, as I tried to identify ways to reach students in all my classes, from self-contained special education to English as a New Language students. Having such a diverse population presented many challenges, as did knowing that there wasn’t one teacher taking my place in my classroom, but rather different colleagues were assigned to cover for me every period of every day. I didn’t feel confident that all my students would have consistent access to my journal posts while I was gone. I relied on a lot of photographs- of the scenery, the technology, the work that was taking place- to engage students no matter how often or with what sort of support they tuned in. I tried to identify online resources that could enrich the activities that I had left and allow students to explore further on their own if they were so inclined. I also tried to use language and examples that could be understood by the average eighth-grader at my school, so I know my blog was less technical than some of the writing that had been produced on NBP cruises in the past (which had the benefit of being accessible for a less-technical audience).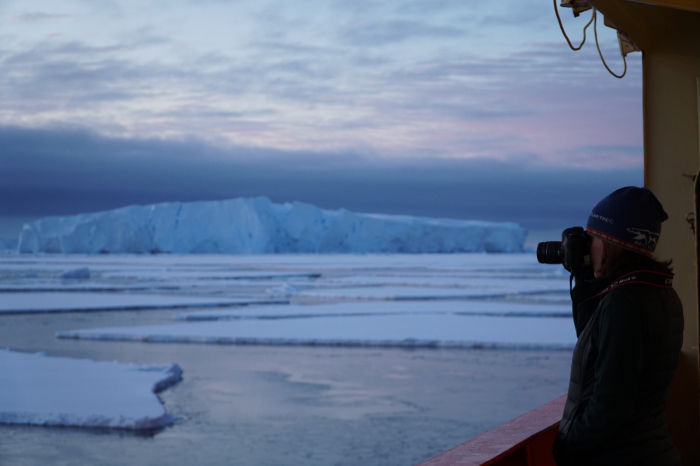
Future Plans
*This program is supported by the National Science Foundation under award 1918637. Any opinions, findings, and conclusions or recommendations expressed by this program are those of the PIs and coordinating team, and do not necessarily reflect the views of the National Science Foundation.
| Attachment | Size |
|---|---|
| Download Report4.86 MB | 4.86 MB |
This program is supported by the National Science Foundation. Any opinions, findings, and conclusions or recommendations expressed by this program are those of the PIs and coordinating team, and do not necessarily reflect the views of the National Science Foundation.
