The PolarTREC Field Experience
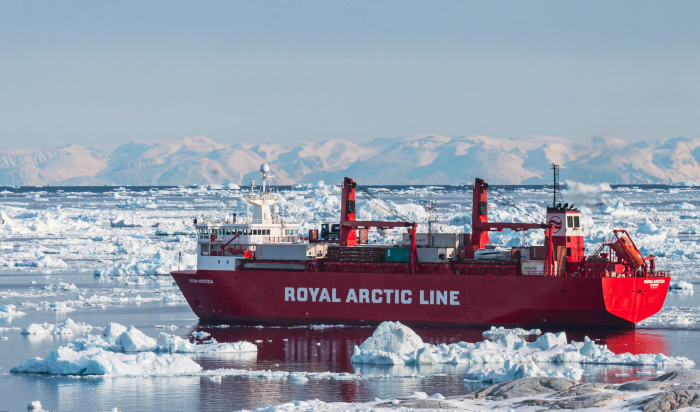
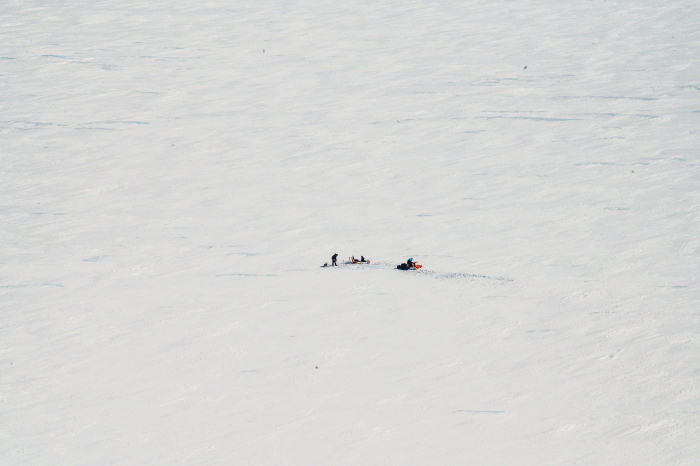
The Greenland Subglacial Tremor Project started its work two years ago, planning logistics and travel for an expedition to Western Greenland. The field experience was delayed for two years due to the COVID-19 Pandemic. We finally deployed to Ilulissat, Greenland to study how glacier meltwater influences the speed and amount of ice flow and the rate of mass loss from the Greenland Ice Sheet into the oceans. This was the spring deployment falling between dates April 24-May 15, 2022. The Chief Scientists on the team included Dr. Mark Behn (Boston College), Dr. Sarah Das (Woods Hole Oceanographic Institution), Dr. Wenyuan Fan (University of San Diego), and Dr. Jeffrey McGuidre (WHOI and USGS). Other vital team members included Nicholas Lau (Graduate Student), and PASCAL Polar Engineer, Kirsten Arnell.

During the expedition, we employed a novel approach using seismic tremor to quantify seasonal changes in the subglacial hydrologic system and ice surface velocities on the Greenland Ice Sheet. We deployed co-located seismic and GPS arrays simultaneously to monitor subglacial meltwater flow and ice surface velocities at a well-studied site on the western margin of the Greenland ice sheet.
The Importance of Educator/Researcher Collaboration
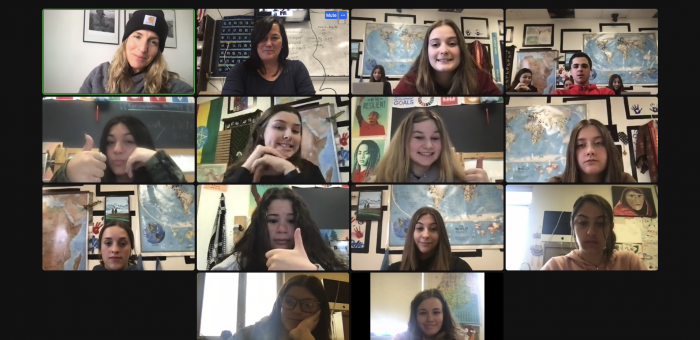
The collaboration between me as an educator and researcher has been mutually beneficial. When I was a kid I did not care much for science classes. I had shut my mind off to them and did not think that I could “do” science or understand it much. I carried this into my adult life and for the first twenty years of teaching largely had that belief still alive inside my head. Collaborating with Dr. Sarah Das and the rest of the team changed my life in that regard drastically. Dr. Mark Behn had a great way of using metaphors to describe glacier dynamics. Dr. Das was reassuring, supportive, and encouraging of my foray into the world of glaciology and continues to be a solid contact that I regularly speak to from my office at The School of Earth and Climate Sciences at the University of Maine Orono where I am currently on sabbatical studying for a Masters degree. My position as educator has afforded me the skill set to offer scientists with ways to publicize their work and design curriculum and lessons that reflect findings and topics involved with glacial dynamics of Western Greenland. In return, scientists have provided direct instruction to my students via Zoom meetings and knowledge to understand the data we collected on the Greenland ice sheet. This collaboration has led to the formulation of a project called, "Icebergs", in Maine, which has students creating visual multimedia exhibits that relate to the impact of sea level rise, in part caused by melting in Greenland, on Maine’s coastal environment and Maine society, economics, and politics. We will be working on another feature to build into a photography exhibit that turn seismic data into music that will accompany public presentations.
The Science Explained
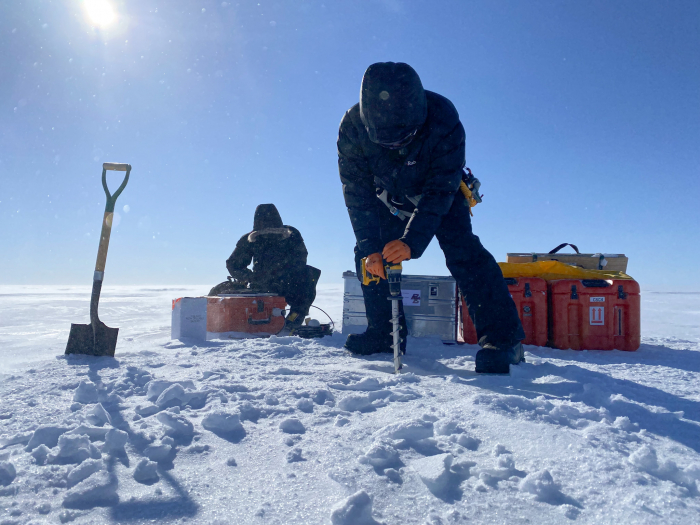
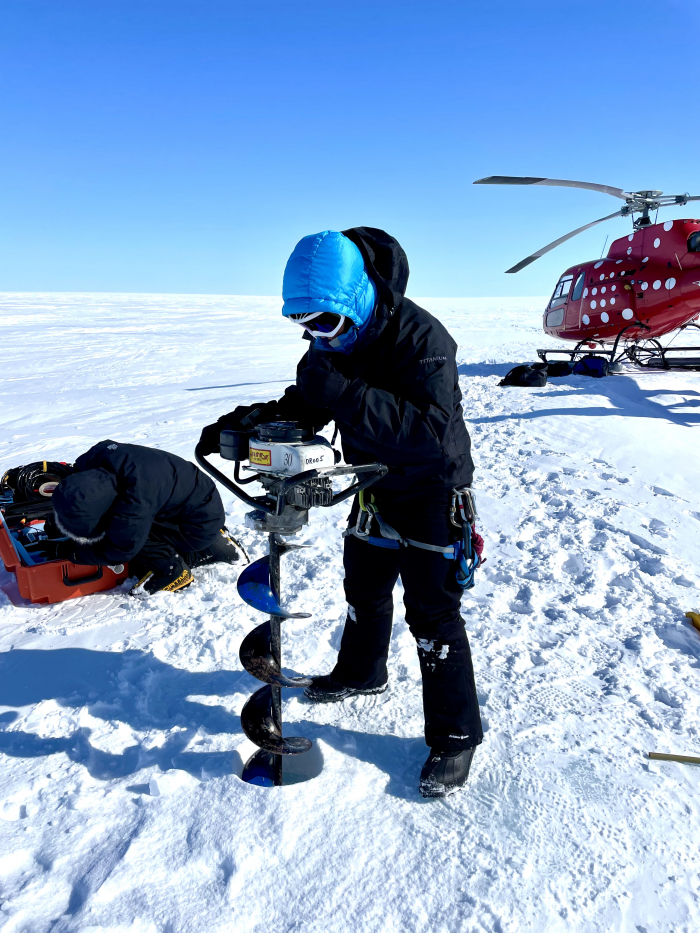
In simplest terms, we were working with GPS and seismic tremor arrays to learn more about how the warming climate in the Arctic is affecting glacier speed in Greenland. Water cannot be seen at the bottom of the glacier since it is under 1000 meters of ice. GPS and seismic tremor arrays are sensitive instruments that record the vibrations of the water as it moves under the ice. We deployed 27 seismic and GPS arrays directly into the ice sheet, drilling holes and linking seismic sensors to MEVO boxes which collected the data over the summer. This data reflects subglacial meltwater flow and ice surface velocities. The data will constrain if and when channelization of subglacial flow occurs and how characteristics of subglacial channels, such as density and spacing, vary with time. Ice surface velocities will be correlated with subglacial channelization to determine whether the process is consistent with existing models for the characteristic seasonal velocity variations observed in the region.
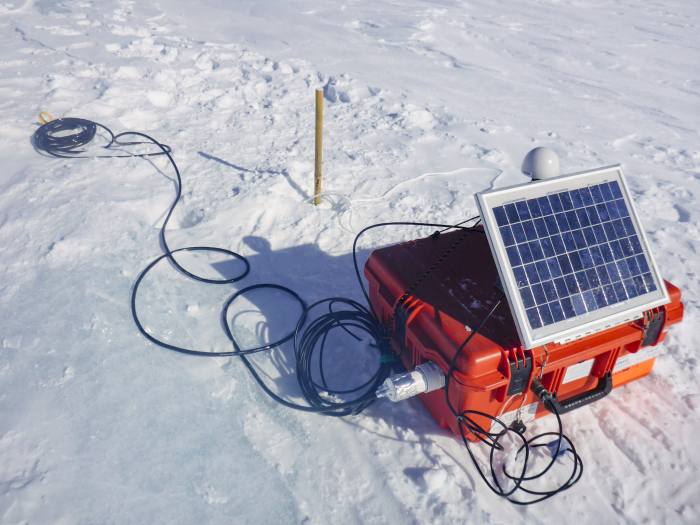
The instruments are collecting both GPS data (which tells us how fast the ice sheet is moving) and seismic data (which will help us determine how much water is flowing along the base of the ice sheet). The idea is that as water flows over the bed of the ice sheet it shakes the ice and we can record that shaking on the seismometers. It’s kind of analogous to what happens when a wave crashes on the shore at the beach and you can feel the vibrations. Our goal is to correlate the amount of shaking to the speed of the ice (i.e., does more meltwater at the base of the ice sheet lead to faster ice flow).
We then analyze data and map where the water goes and how that changes between winter and summer, while at the same time also recording how quickly the ice on the surface of the ice sheet moves. The hypothesis is that there are pools and rivers that form under the glacier and that are changing over time.
Deploying and testing new methodologies for mapping the spatial and temporal evolution of the river system that develops under the Greenland ice sheet each summer will hopefully reveal how the river system impacts the speed of the overlying ice sheet and provide a powerful new technique to study subglacial meltwater flow in regions that are difficult to access.
Linking PolarTREC Science to my Classroom/Audience/Institution and Community
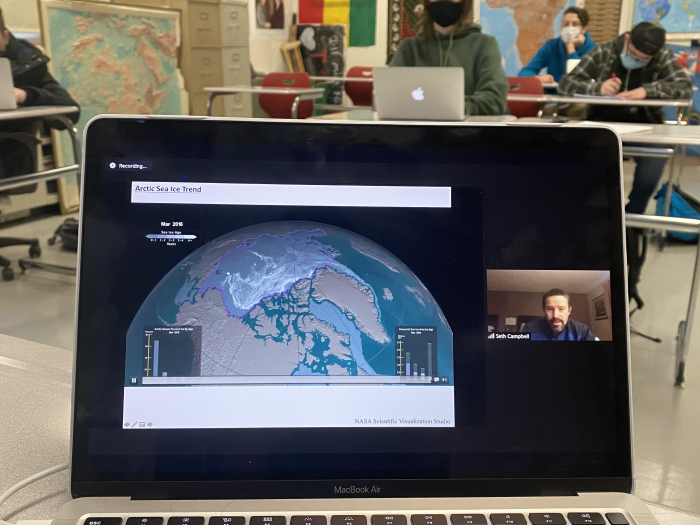
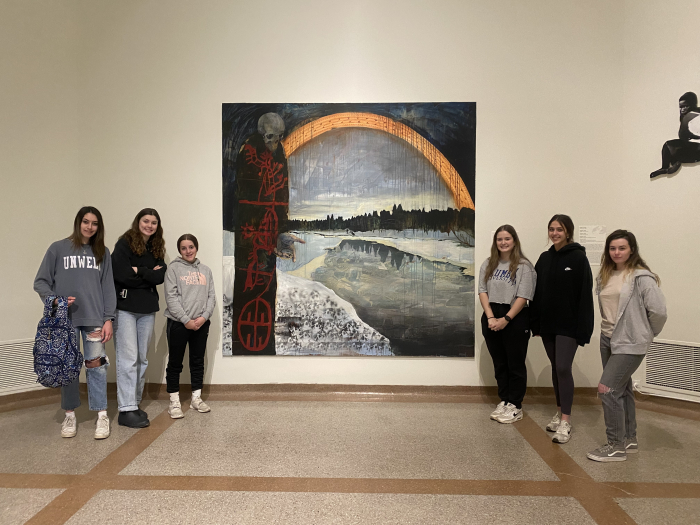
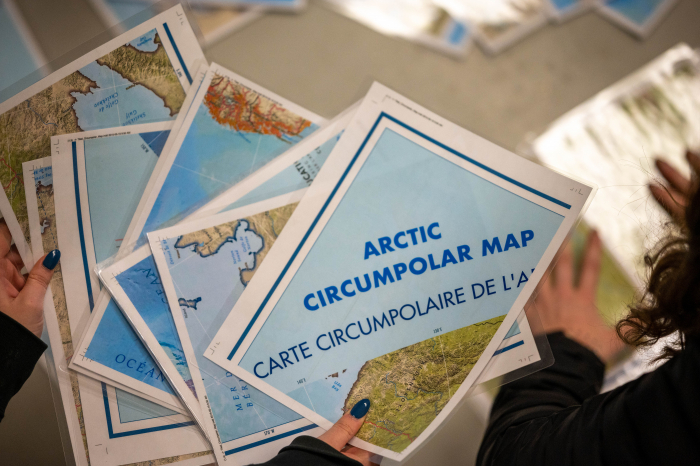
We created a new course developed at our high school, Arctic Climate Studies. The course began as an interdisciplinary offering for students grades 9-12 as an elective, specifically engaging and encouraging students who had not experienced a lot of success in the social science discipline, although the course did end up with a varied audience encompassing students from all grades 9-12. We invited Dr. Seth Campbell who is a former PolarTREC researcher glaciologist from University of Maine’s School of Earth and Climate Sciences to give introductory lessons on glaciology and surficial geologic history of Maine. Visual arts were used in the course to provide a lens for learning. Students use photography and visual storytelling a lot. A field trip to the Portland Museum of Art to view the North Atlantic Triennial Down Иorth Exhibit, co organized by the Portland Museum of Art, the Reykjavik Art Museum, Iceland, and the Bildmuseet Sweden introduced them to contemporary art of the North Atlantic region. They had a chance to view a series of maps from the Osher Map Library and Smith Center for Cartographic Education which explored ideas of turning the North upside-down. Back in the classroom students learned from one of the exhibit artists, Justin Levesque who spoke about relationships between Arctic images and objects and social media. We invited Maine Senator Angus King, one of the co-founders of the Arctic Caucus to speak about security and economic interests between Maine and the Arctic and the event was attended by students representing over 10 schools across Maine. Students participated in the 2021 Camden Conference, a foreign policy conference held every year on the coast of Maine dedicated to providing public discourse on topics of global concern. The topic that year was Arctic Geopolitics: A Region in Peril.
Primary Audience and Public Impact
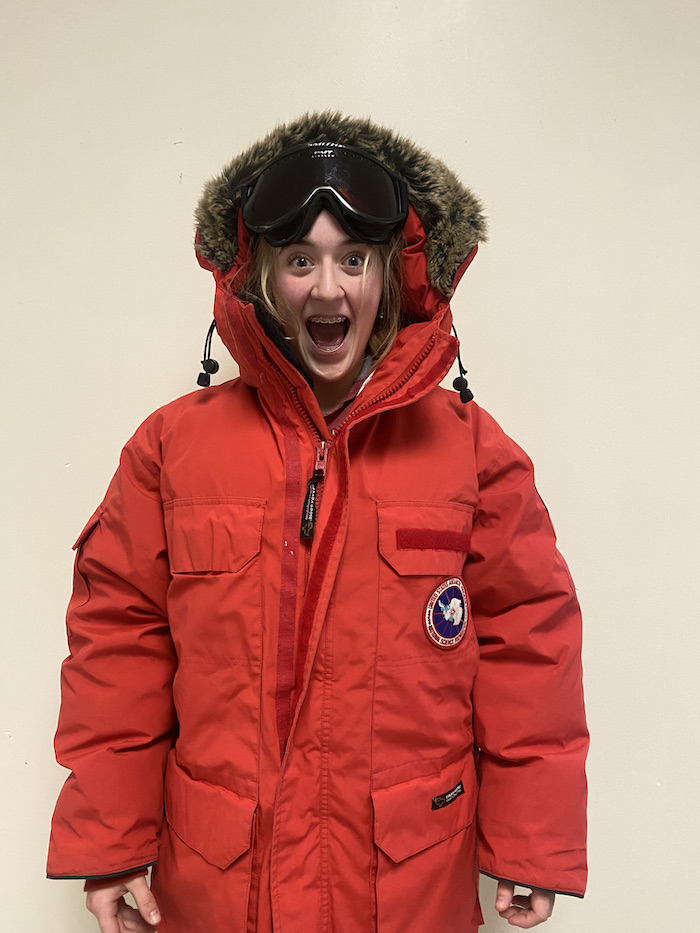
The primary audience were our students, Maine teachers, teachers across the United States, and the general public. Students regularly shared their knowledge within the school in a series of activities which included a demonstration involving a polar map which was left hanging for the rest of the year to engage individuals walking by with a perspective of the world from a polar view and set up a hallway demonstration and activity that had students getting pictures taken with the Extream Cold Weather (ECW) gear kit sent to us from the Arctic Research Consortium of the United States (ARCUS). Students created photography pieces as part of their "Icebergs in Maine" project in which they created photographs that revealed evidence of sea level rise on the Maine coast superimposed with photography I had collected of icebergs in Greenland and submitted them for a virtual exhibit for this year’s American Geophysical Union (AGU) Conference. They started the process of creating a public photography exhibit which will be built upon during the Spring 2023 semester and identified the Maine statehouse lobby as being the location they would like to see the exhibit put on display for lawmakers and the general public.

Expectations and Outcomes
Initially, I expected to be part of a team that would travel within a few months of acceptance, and I would not know what I was doing and would be taking as many pictures as possible and as much film and video as I could to try to figure it out as I went. Initial expectations also included that I would receive training sessions about science and glaciology, that we would travel by boat to glaciers, that we would have to survive the trip in frostbite-like conditions, that we would be camping on a glacier, eating seals, and seeing lots of whales and being fearful that I would have to be near the edge of high glaciers. I dreamed of running with the musk oxen. Only the training happened, the rest never came to fruition. This says a lot about popular media depictions and knowledge of the Arctic, epitomized in National Geographic photos, YouTube videos, and movies and the lack of polar related content that is included and taught in schools, which in the case of my school was zero. That was until now.
What I found was a two year prep period full of different types of training both informal and formal thanks to researchers and glaciologists, Dr. Mark Behn, Dr. Sarah Das, and Dr. Seth Campbell of the University of Maine Orono who although not a team member, is a former PolarTREC researcher who provided me with a lot of assistance to help prepare me for the expedition. Collectively they taught me a lot about topics related to the cryosphere, the surficial geologic history of Maine, evidence of glaciers that once covered Maine, global sea level rise, and the Gulf of Maine. They recommended readings, provided hands-on training in person when they could, and answered every question with patience. These were all topics that are related to the Greenland Subglacial Tremor Project’s goals of examining the Greenland Ice Sheet’s contribution to global sea level rise and studying surface runoff and how it affects the velocity of the ice sheet and melting that occurs faster there than anywhere else in the world and were essential pieces of knowledge to assist me in meeting my professional goal of learning about cryospheric systems. The aim of this expedition was to better understand glacial hydrology and Greenland’s potential response to climate change. The work we did and the data currently being collected assists the team in trying to figure out time scale and pathways through which meltwater reaches the ice sheet’s base and its consequence on something called basal motion, or in simple terms, the act of a glacier sliding over the bed due to meltwater under the ice acting like a lubricant.

Far from being a passive bystander taking photos and documenting work being done by the team on the ice sheet, I was invited in as a fully participating team member who was consistently encouraged to contribute thoughts and questions. If they sensed I did not understand, team members re-explained using a variety of metaphors and real life examples that helped tremendously. I had to stick to strict protocols when it came time for placing seismic tremor sensor technologies into the ice sheet in order to ensure data being collected measuring vibrations could help scientists more accurately identify what goes on a mile and a half below the surface we were standing on. Even before that technology made it out onto the ice sheet, I took part in pre-field huddle testing of all equipment, entering important data to help the field engineer solve any issues. I drilled holes, put together equipment, prepared sling loads for the helicopter, used a torque wrench for the first time in my life, numbered and labeled anything the polar engineer requested, took inventory of things coming and going to the field, and helped organize the arrays.
Further Education and Outreach Opportunities
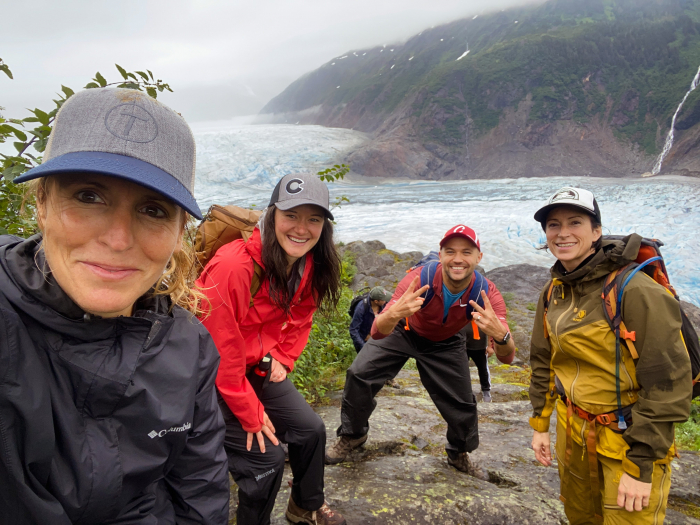
Last summer was spent presenting to teachers across the United States about the PolarTREC teacher and student experience at the following events: (1)National Science Teaching’s Annual Conference in Chicago; (2) University of Maine’s PolarSTEM Conference in Juneau; and (3) Fulbright Program’s Global Teaching Dialogue. I will present again in October for the Fulbright Teachers for Global Classroom Program’s incoming cohort about linking polar science to Maine and we will hopefully be presenting at the AGU’s annual meeting with Sarah Johnson and Jon Pazol, both of the 2020 PolarTREC Teacher cohort, about our field experiences and how we translate them for audiences.
Further education for me is the Master’s Degree Program that I just began at the University of Maine at Orono’s School of Earth and Climate Science studying interdisciplinary education, Earth and climate science, and visual science communication. This undertaking will assist me with development of resources, lessons, and units that will be more pedagogically informed and it will assist me with achieving my dream of assisting polar scientists in sharing Polar data and knowledge in engaging visual ways using a combination of digital photography, audio created from data, and citizen science for students and the general public.
| Attachment | Size |
|---|---|
| Download Report (PDF)7.15 MB | 7.15 MB |
This program is supported by the National Science Foundation. Any opinions, findings, and conclusions or recommendations expressed by this program are those of the PIs and coordinating team, and do not necessarily reflect the views of the National Science Foundation.

