Topography of the Seafloor
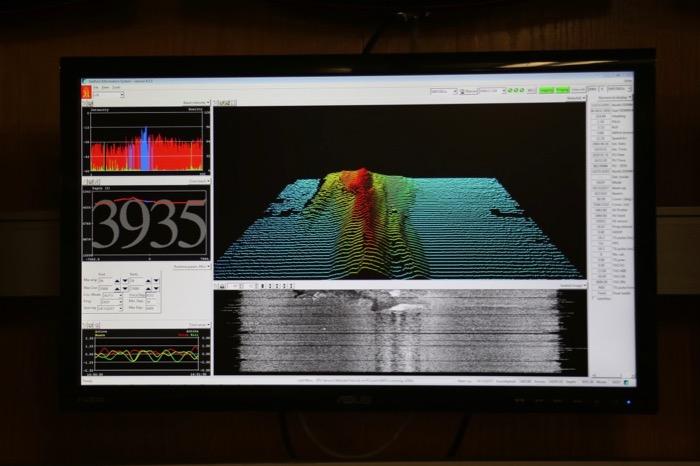
Prior to my participation in this expedition, I can't say that I had ever thought about bathymetry, or the study of the shape of the seafloor. While land topography, with its uphills and downhills, has a lot of relevance to my life, I couldn't imagine why the mountains and valleys hidden deep underwater should matter to me. Scientists in the Thwaites Offshore Research (THOR) project recognize the importance of bathymetry to understanding why the Thwaites GlacierA mass of ice that persists for many years and notably deforms and flows under the influence of gravity. is melting so fast. Much of the work we are doing on the R/V Nathaniel B. Palmer icebreaker is focused on improving the level of detail we have in our maps of the seafloor around the base of the glacier. What's the connection between bathymetry and the melting glacier? Let's head back to land to understand better.

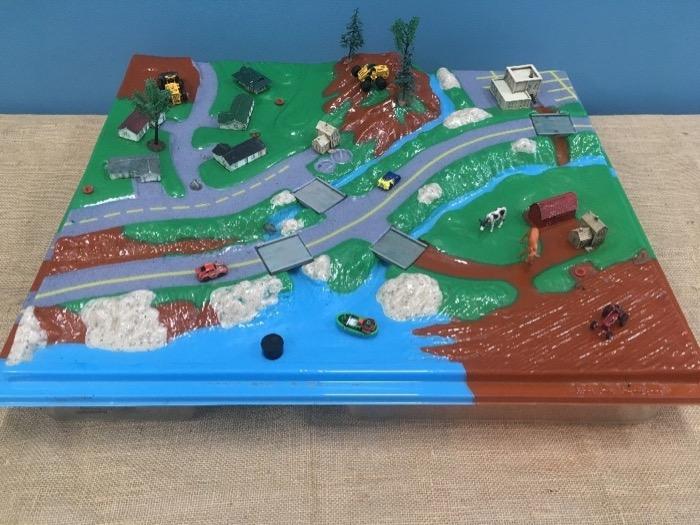
Before I started teaching in Brooklyn, I worked as an Environmental Educator on the Hudson River Sloop Clearwater and later for the Massachusetts Audubon Society. At both jobs, I sometimes used a watershed model to show how and where water moves across land to drain into local rivers. Using a plastic landscape from Enviroscape that includes hills and valleys, houses and businesses, and fields and forests, I poured water on different areas of the model and we'd watch it cascade down slopes and across flat areas and eventually drain into a valley, carrying with it any pollution (often modeled with drops of food coloring) and sediments (typically represented by evil glitter) it picked up along the way. There are lots of lesson plans available to help teachers create their own watershed models with students - one I like is geared towards younger kids but could be modified for middle school. In fact, middle school students could figure out how to create their own watershed model after hearing how it is supposed to work, using supplies such as small containers, water-based markers, and a plastic shower curtain. Regardless of how the model is created, the end result should be the same - water flows down to the lowest valleys of the model.

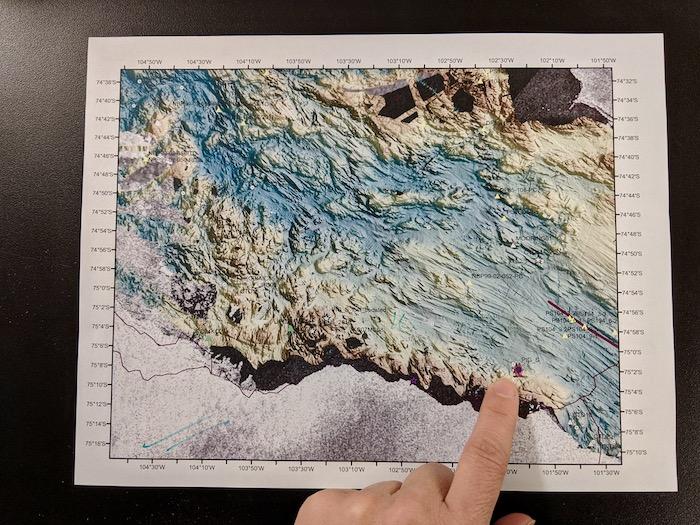
The same thing that happens on land - water moving down slopes and ending up at the lowest point - is also happening on the seafloor. The bathymetry creates mountain highs and valley lows, and currents of water flow down the slopes and into the troughs created by the shape of the bottom. Seven researchers here on the Palmer are authors of a paper (which will soon be published in the scientific journal CryosphereThe frozen part of the Earth's surface. The cryosphere includes the polar ice caps, continental ice sheets, mountain glaciers, sea ice, snow cover, lake and river ice, and permafrost. For more information about the cryosphere, click here.) that describes the existence of low channels in the seafloor in front of Thwaites - and these troughs are carrying the CircumpolarLocated or found within the Earth’s polar regions. Deepwater (CDW) right to the grounding line of the glacier. The normal water of the Amundsen Sea is so cold that it barely causes any ice to melt. But the CDW is just warm enough - maybe only 0.5 - 1.5˚C above freezing, but that is all it takes - to destroy the ice of Thwaites GlacierA mass of ice that persists for many years and notably deforms and flows under the influence of gravity..
Some of you might wonder - how can water flow in water? Isn't it all just water? Turns out, there are different types of water in the water, and some of the water is more dense. Want to see for yourself?
Try this at home:
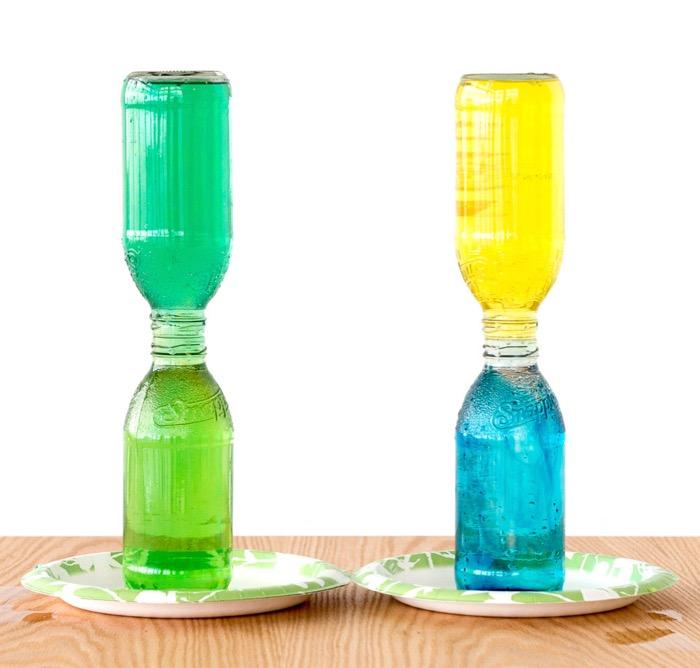
Here's an easy experiment requiring only basic supplies - you will need two identical clear jars, a few index cards, two different colors of food coloring, some very cold water and some pretty hot water. Follow the detailed steps on the Exploratorium's website. Common sense reminders for those of you short on common sense: Do this experiment in a container or right in the sink if you don't want to make a mess. Definitely practice inverting a full jar of water with an index card once or twice before you try to line up your jars for the experiment. Also, don't spill hot water on yourself. Finally, wear goggles if you think it will make you look more like a scientist.

What happens when you invert a jar of cold water over a jar of hot water and then remove the barrier between them? What happens when you do the experiment the opposite way, with the hot water in the top jar and the cold water in the bottom one? Because hot water is less dense than cold water, it will float on top of the cold water. If we apply what we learned from the experiment to our real-life situation... Wait a minute. I told you that the CircumpolarLocated or found within the Earth’s polar regions. Deepwater is WARMER than the other water in the Amundsen Sea - based on the experiment, that means the CDW should float, not sink down into the channels on the seafloor and flow straight in to attack the bottom edge of the glacier. There is another factor at work here, something else about the CDW that makes it denser and causes it to sink.
It's the Salt
If you read all the way down to the bottom of the Exploratorium experiment, you get to this: "What do you think would happen if you had tried this experiment with a jar of salt water and a jar of fresh water? Use food coloring to color the salt water a different color than the fresh water so you can see what happens."
Turns out, the CDW has more salt than the normal waters of the Amundsen Sea, and that causes it to sink to the lowest points in the seafloor, which happen to be channels that carry that dangerously warm water to the grounding line of the Thwaites GlacierA mass of ice that persists for many years and notably deforms and flows under the influence of gravity.. Scientists now know a major reason the glacier is melting so fast, but there is still much more to learn down here where the most dangerous piece of ice in the world meets the ocean.


Comments