Today’s Journal
We have data streaming in! Well, we actually have to hike out to the field sites with a laptop to download most of the data, but it is exciting to know that all the wire connecting that we did is actually working. We are starting to get some snap shots of data to give us a sense of what is happening underground and in and out of the greenhouses.
Making thermocouples
In a previous journal, I mentioned that we have thermocouples that record temperature at depths of 2, 4, 6, 8, 10, 15, 20, 25, 30 and 35 cm inside, on the edge and outside of the water tracks. Today I made two more thermocouples in the lab and then installed them in the field with Sarah.
Each thermocouple has a predetermined length that will allow the wire to run from the hole in the ground into the cooler to attach to a data logger that will record the temperature in the ground. To make the thermocouple, I started by cutting and labeling the wires for each depth mentioned above. Then I stripped the wire and twisted it together.
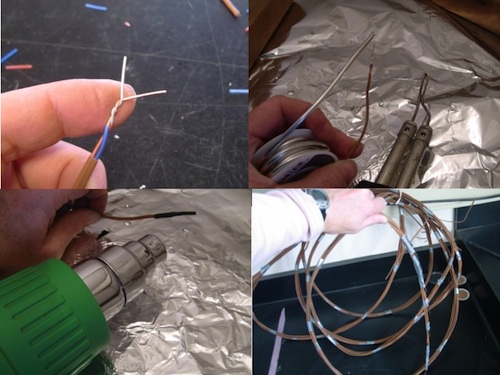
Then I learned another new skill- soldering! I soldered the twisted wires and then used heat shrink and the heat gun to cover them. All this effort is to make sure we get a good connection between the wires and to keep the water out. Then last part is to tape the thermocouple together making sure to get the correct ends at the proper location. The 35cm wire is the longest, then the 30cm wire is taped to that wire and so on, until all the wire ends are in position.
Installing thermocouples
You might recall that we are in an area with continuous permafrost. We know from our thaw depth surveys that the current active layer thaw depth is only 5 to 10 cm. So how do you install wire down 35cm into the frozen ground? This is the fun part!
We use a Mapp gas torch to heat the end of a piece of rebar, then angle to 25 degrees and pound away. Being taller than Sarah, I had some added leverage on the pounding that helped in our effort to drive the rebar into the ground. The series of photos below will give you a look at the process.
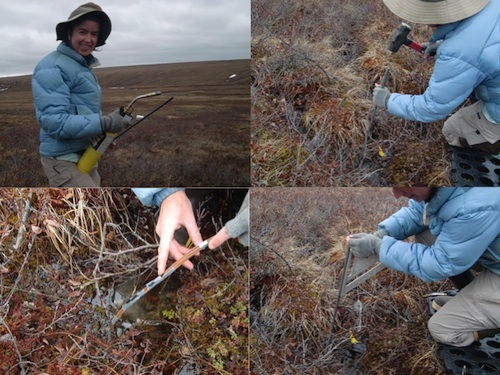
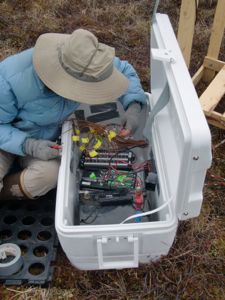
Now you can see the importance of labeling the other ends of the wires as Sarah connects them to the data logger.
What can ground temperature tell us?
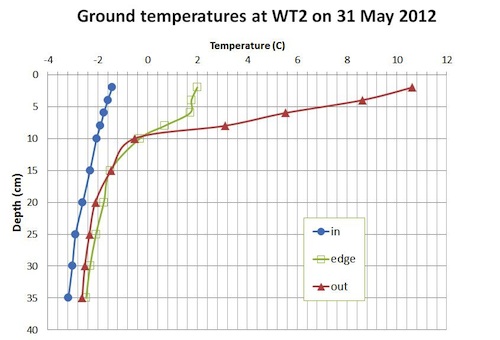
The above graph shows ground temperature at different depths inside, on the edge and in the water track. You will notice that below 15 cm the ground is very similar in temperature at all locations and still completely frozen. At 10 cm and above we start to see differences in the ground temperatures. Keep in mind that when this data was taken, the snow had just melted off of the entire site with the water track area melting out last. The area outside the water track has been melted for at least a week or two, so that area has been warmed. These temperature trends will be very interesting to watch through out the year. We expect that the water track area will thaw more deeply than the edge area, so we’ll have to see if that actually happens.
Greenhouses
During my first week, I helped build a greenhouse on one of our sites. One of our learning experiences has been that a greenhouse design that works in Fairbanks might not work as well in the field when subjected to wind and snow. We have come up with improvements for next years design.
Even though the greenhouses had difficulty standing up to the wind, we left them out in the field and used ibuttons to record temperature inside and outside of the greenhouse. This week we took down the greenhouses and downloaded the information from the ibuttons. We found that the mean greenhouse air temperatures were 4-5 degrees C warmer than the mean ambient air temperatures at the two sites over the period that the greenhouses were deployed, which was approximately 4 weeks.
Plant Phenology
As we took down the greenhouses, we noticed the plants inside the greenhouse looked quite different than the ones outside.
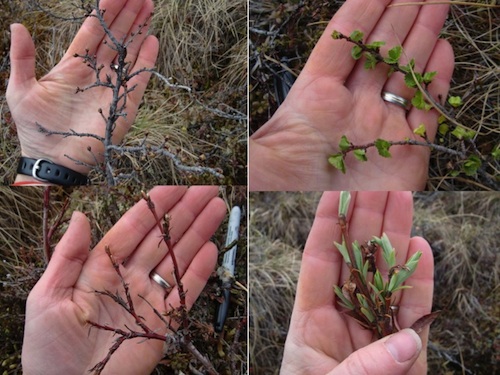
Our greenhouses gave us some insight into plant phenology (the study of the timing of natural events). With a 4-5 degree C temperature change the plants inside the greenhouse we much further along in their leaf-out as compared to the plants that are outside the greenhouse. When applying this to the real world, if air temperature increases it is possible for plants to leaf out sooner. What would be the potentially positive and negative impacts of an earlier leaf out in the Arctic? I’ll come back to this in the next journal.
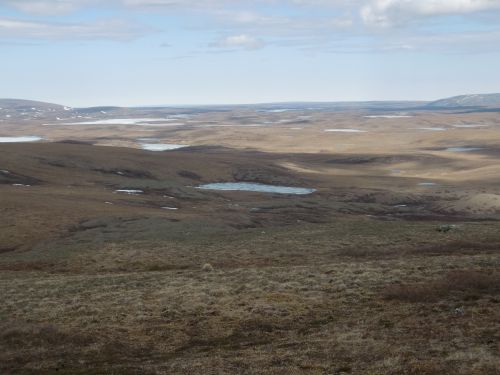
#Question to PonderI went for a short hike up to a high point around camp today with a few other folks including Susan Steiner, another PolarTREC teacher. It was fun to have some time to catch up with Susan since we have both been working so hard with our own teams. Even though I have lived near the mountains now for 10 years, I have never experienced anything like the view at the top of our hike- 180 degree view of mountains! It was unbelievable. Take a look…
http://youtu.be/uJa1yc4hX9Q
My question to you is, when the average yearly precipitation is only about 35 inches, how is there still so much standing water in the Arctic tundra?


Comments