An Update from MOSAiC

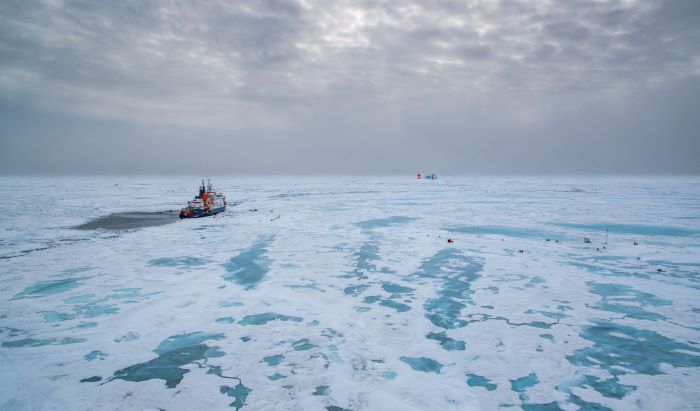
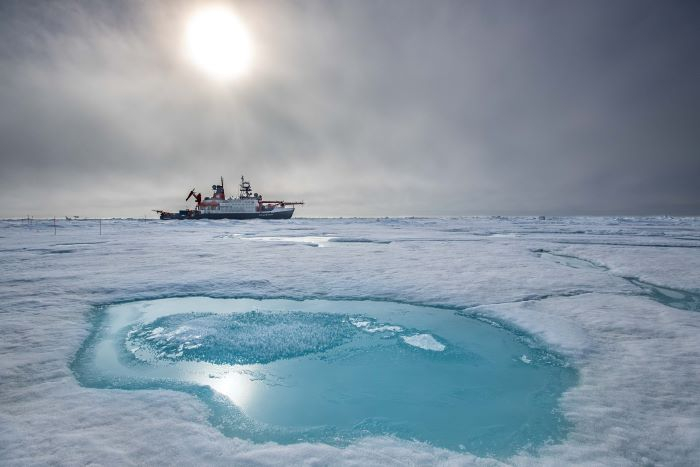
On July 29, researchers and expedition crew began the process of dismantling research equipment, loading it all back onto the Polarstern, and evacuating the ice camp. The ice camp had been home to the expedition since early October. In fact, July 29 was exactly 300 days after the first equipment had been installed on the ice. One day later, the ice floe broke into many smaller pieces as the team worked to rescue the last few pieces of equipment. Then, they visited some sites of the larger distributed network to recover additional equipment; other sensors, such as oceanographic buoys, were left in place to continue to record data through the last days of summer.
In a press release from the Alfred Wegner Institute, Expedition Leader Markus Rex stated, “We’ve successfully monitored the lifecycle of the MOSAiC floe from early October last year to its end. It carried us through the Arctic Ocean for a total of 1700 kilometres, from the Laptev Sea, past the North Pole and all the way to Fram Strait. Here at the sea-ice edge its natural lifecycle comes to an end: the fragments will continue to grow thinner and be broken up by waves, until they ultimately melt and once again become part of the seawater, from which the floe was formed nearly two years ago off the Siberian coast. Accordingly, the concept for the expedition has been completely fulfilled."

But the expedition is not finished yet! Soon, the Polarstern will motor north, where new ice will begin to form in the coming weeks. This is the final piece of the ice life cycle that researchers are hoping to document. Before going north, though, the Polarstern will rendezvous near the ice edge with the Russian icebreaker Akademik Tryoshnikov to exchange crew, supplies, food, and fuel for the last leg of the expedition. The final months of observation, data collection, and sampling will continue into September or early October. Then researchers will begin the equally daunting task of making sense of all the new information they have gathered and revealing how changes in one component of the Arctic ripple through the highly-coupled systems.
The Bigger Picture of Arctic Change
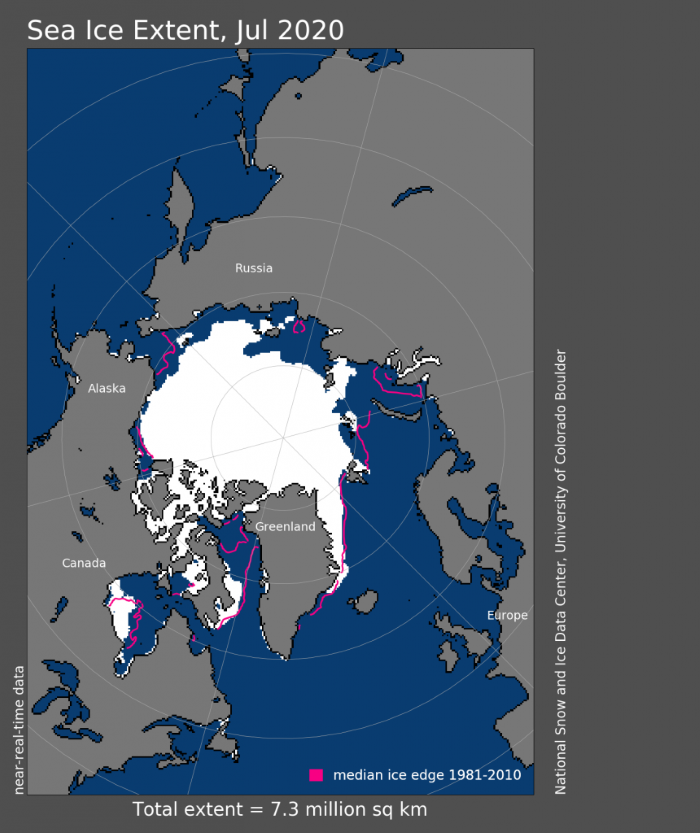
This summer also marked the most rapid loss of sea ice ever recorded in July.
Part of this is likely due to beginning ice thicknesses that were lower than normal, as observed last October and November, as well as the faster than usual drift that impacted many floes of sea ice beyond the MOSAiC ice camp. In addition, higher than average air temperatures in various areas of the Arctic have contributed to lower ice extent. First, a cell of high pressure and warm air over the Siberian Arctic led to temperatures in May and June that were 6 degrees Celsius (approximately 10 degrees Fahrenheit) warmer than average! On June 20, the Siberian town of Verkhoyansk, Russia hit a record temperature of 38 degrees Celsius (100.4 degrees Fahrenheit). This is the highest temperature ever recorded in Verkhoyansk since records began in 1885. Verkhoyansk is located north of the Arctic Circle, and the average June high temperature is 20 degrees Celsius (about 68 degrees Fahrenheit). These warm air temperatures led to early snowmelt and permafrost thaw. The impacts of these changes have been far-reaching across the region, including an oil spill, sea ice loss, and major wildfires. The smoke from the huge Siberian wildfires even affected air quality all the way over here in Homer, Alaska!
The phenomenon unfolding in Siberia is also an excellent and frightening example of a feedback loop in the Arctic climate system. As the forest and tundra burned this summer, over 60 million tons of carbon dioxide were released into the atmosphere. In addition, the heat from the fires thawed more permafrost. And as the permafrost thaws, the powerful greenhouse gas methane is released. In this positive feedback loop, climate change is very likely to be the cause of these massive forest fires and the forest fires are feeding future climate change. Unfortunately, positive feedback loops are common in the Arctic region and contribute to something called Arctic Amplification. Arctic Amplification refers to the fact that the Arctic is warming much faster than the rest of the planet.
Then, in July, a warm air cell settled over the Central Arctic Ocean. A stable atmospheric pressure system has kept this warm air in place over time and accelerated melting of snow cover, formation of melt ponds, and break up of sea ice.
MOSAiC set out to make detailed observations of a changing Arctic system. Many who study the Arctic suspected that 2019-2020 would be one of the last years in which an ice-based expedition like this would be possible. The events of this spring-summer suggest that they are correct. Record low sea ice concentrations going into fall may preclude freeze-up of really thick floes of ice that can survive multiple years in the Arctic, and it is possible this pattern will continue year after year until major drawdowns of greenhouse gases take place.
Education Extension Learn more about practical, effective approaches to stopping catastrophic climate change at Project Drawdown. "Drawdown" refers to the point at which levels of greenhouse gases in the atmosphere will stop rising and begin declining. This project shares over 100 possible solutions that will help us reach Drawdown faster, safer, and more equitably. The 21 day Eco-Challenge is a great place to begin.
At MOSAiC Monday, you can find updates about the expedition as well as activities for students and resources for teachers. Check out the most recent MOSAiC Monday for some cool activities and scroll to the bottom for data about the Polarstern's location, as well as air temperature and sea ice extent. Can you figure out which days the Polarstern was south of the ice edge to rendezvous with other ships? On what days was the air temperature warmest? What was the difference between the hottest temperature of the summer and the lowest temperature of the winter?


Comments