Team Trawl-
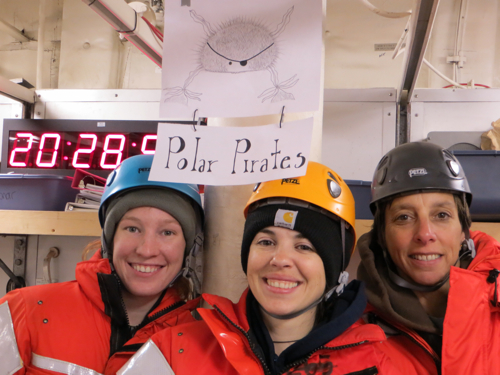
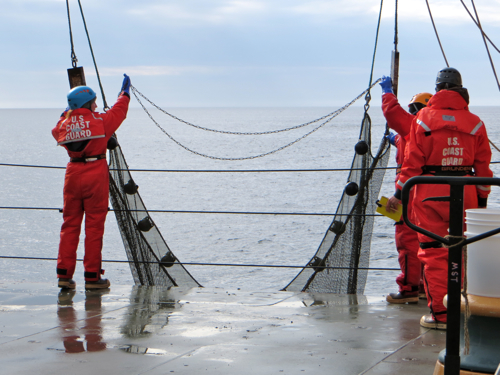
Meet Team Trawl, Dr. Brenda Konar, Alexandra Ravelo, and Kimberly Powell from University of Alaska Fairbanks. These scientists work the trawl net on the back of the ship. The large trawl net drags along the surface of the bottom collecting crawling organisms. The net is lifted onto the deck; the organisms are released from the net into a large bin; and their work is just begining.
Let the sorting begin
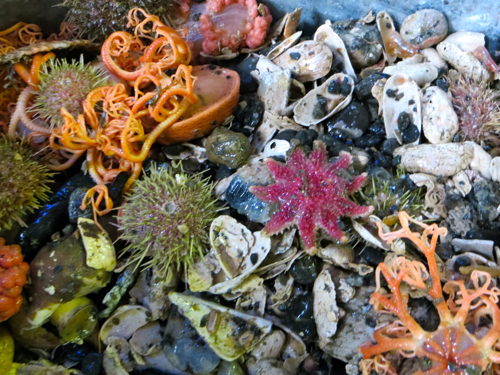
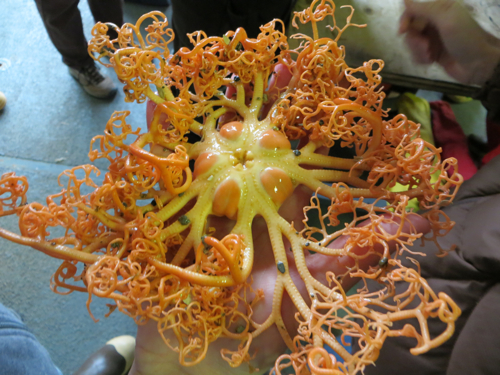
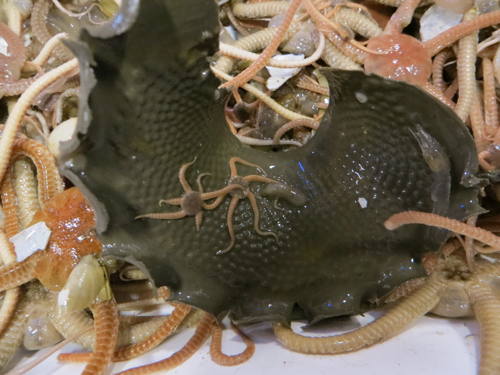
The team surrounds themselves with buckets with seawater. Someone scoops out a handful of organisms and places them on a tray. With hands and tweezers, the team and any willing volunteers quickly sort the catch into the respective buckets by species. Brittle stars get the 5-gallon bucket as their numbers will be in with thousands. The other buckets hold sea stars, crabs, snails (gastropods), shrimp, anemones, and soft corals. The sorting can take several hours.
Count, weigh, measure, and document
Collecting the data takes time and patience. Each species must be counted and weighed. The crabs, gastropods, and sea stars are also measured for length and width. This data is recorded and will be put into a database when the scientists return home. Today, the team collected 250 crabs, 2 sea stars, and over 2000 brittle stars at the first station. Their next trawl will be close to midnight which means they will be sorting and recording data most of the night.
Database
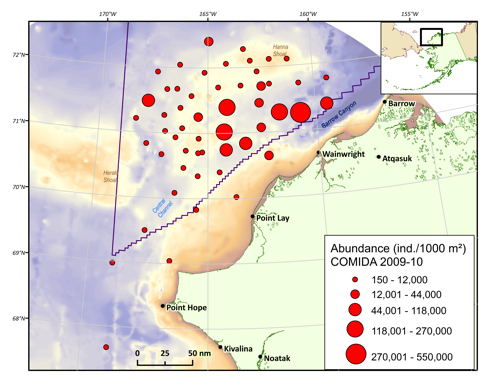
Once all of the data is entered into a database, the scientists are able to map the quantities and locations of each of the organisms. Then they can compare their data to other data that was collected on the ship at each station. They are trying to figure out what environmental factors are best for each organism such as size of sediment, temperature, salinity, nutrients, and water mass.
After the analysis of the data, the scientists are able to make conclusions and communicate their work through publications, conferences, and outreach.
Watch the short time lapse video of a gravity core and trawling. View the changes in the ice as it goes by the ship.
http://youtu.be/eYsJQrHPboc


Comments