Article Review: Sunlight Controls Fate of DOC (Cory, et al., 2014)
Austin, TX
June 1, 2019
Title: Sunlight Controls Water ColumnHypothetical 'cylinder' of water between the surface of the ocean and the ocean bottom. Processing of Carbon in Arctic Fresh Waters
Authors: Rose Cory, Collin Ward, Byron Crump, George Kling
Journal: Science
Date: August, 2014
In my previous post, I addressed the different means by which dissolved organic carbon (DOC) is oxidized into carbon dioxide in Arctic watersheds. The scientists I’m working with this summer – Drs. Rose Cory, George Kling, and Byron Crump -- are concerned with the specifics of this process. The thought here is that if more is learned about how organic material released from permafrost is broken down into greenhouse gases, climate models can be modified to better account for the permafrost positive feedback loop.
In this article review, I will focus on important work they published in 2014.1
Background
The factors at work in oxidizing Arctic DOC are quite complicated and not very well understood. As previously mentioned, the main culprits for DOC oxidation in the Arctic are bacterial respiration and photooxidation. Prior to the work of Cory, et al., bacteria were given most of the credit.
Purpose
Cory and her colleagues wanted to further investigate the respective roles of bacterial respiration and photooxidation in the oxidation of Arctic DOC. No prior study had simultaneously evaluated both bacterial and sunlight-driven DOC oxidation pathways.
Experimental Setup
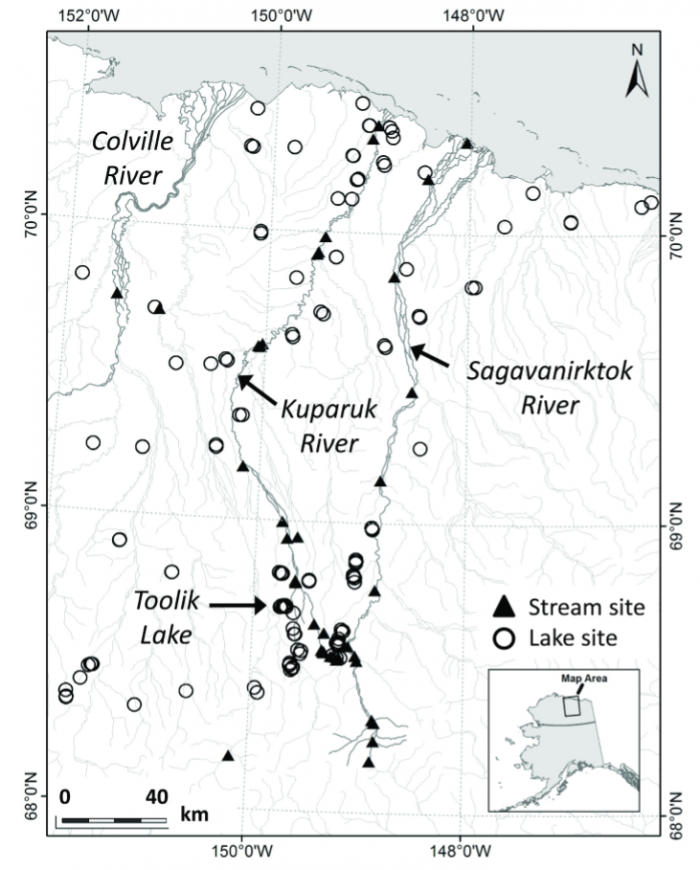
The scientists collected water samples from a wide variety of streams, rivers, and lakes in the Kuparuk River basin on the North Slope of Alaska during the summers of 2011-2013.


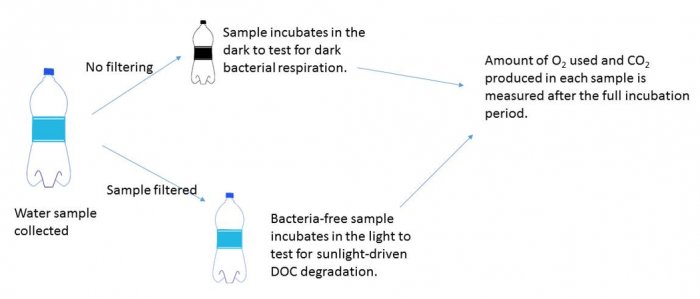
The group used fluorescence spectroscopy to quantify how much light was being absorbed by sunlight-exposed samples. But water in the Arctic is contained in streams, rivers, and lakes, not small containers. If a water column is deeper, more of the water in the column (and its contained DOC) is protected from sunlight. Accordingly, the group needed to also quantify the actual light availability in the water at all of their test sites - how much light decreases with depth in the water column - which they did using a Compact-Optical Profiling System (C-OPS). This system is slowly lowered into the water column and measures absorbance as it descends. Combining this data with the absorbance, O2 consumption, and CO2 consumption data for their samples, they were able to calculate total amount of DOC degradation due to sunlight at their test sites. In the end, they were able to effectively determine rates of water column breakdown of DOC by sunlight and bacteria.
Results
The results of this experiment indicate that 55% of the DOC broken down in the waters of the Kuparuk basin is completely oxidized to CO2, while 45% is partially photooxidized. Importantly, the group found that light was involved at least 70% of DOC processing at all of their study sites. In other words, conflicting with the prevailing notion at the time, rates of photochemical oxidation drastically exceeded rates of bacterial respiration in Arctic streams, rivers, and lakes.
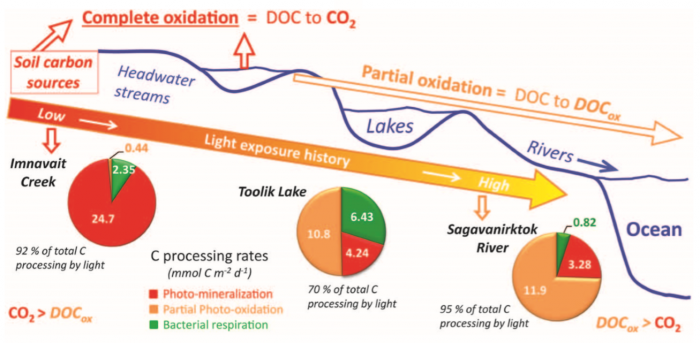
The below graphic summarizes results for three important study sites: Imnavait Creek (a headwater stream), Toolik Lake (further downstream), and a Sagavanirktok River site (even further downstream). For each site, the pie chart illustrates the relative importance of different DOC oxidation processes - photo-mineralization (complete photooxidation) vs. partial photooxidation vs. bacterial respiration.

Discussion
The group suggests three major reasons for why photochemical processing of DOC is more important than bacterial respiration in Arctic watersheds. First, evidence from their dark bacterial respiration experiments suggests that rates of bacterial respiration in cold Arctic waters are on the low side when compared to other locations on the planet. Second, their areal spectroscopic measurements indicate that DOC in Arctic waters is more susceptible to breakdown by light than DOC in other locations on the planet. Third, Arctic waters are generally on the shallower side and completely unshaded, serving to substantially increase DOC exposure to sunlight.
The authors also offer an explanation for the trends in the above pie charts, comparing upstream and downstream environments.
- Trend 1: Dominance of photo-mineralization (complete photooxidation) of DOC in headwater streams (e.g. Imnavait Creek).
- Trend 2: Increased importance of partial photooxidation in sites further downstream (e.g Toolik Lake and Sagavanirktok River site).
As the authors explain, when DOC enters a watershed, easily photooxidized components are completely oxidized readily and leave the stream as CO2. This explains dominance of complete photooxidation in headwater streams, consisting of DOC with little prior light exposure. Freed of easily photooxidized components, downstream DOC is less susceptible to complete photooxidation. Accordingly, as you move downstream, partial photooxidation begins to dominate over complete photooxidation.

The Gist of It All
This work is very important in helping the scientific community better understand the factors that are affecting oxidation of DOC in the Arctic and the relative rates at which these things are happening. This directly helps scientists improve climate models to better account for the permafrost positive feedback loop. Here’s a great video featuring scientists Rose Cory, Jason Dobkowski, and Collin Ward explaining this work, with footage from the actual study sites used:
Comment below!
-
Cory, R. M., et al. “Sunlight Controls Water ColumnHypothetical 'cylinder' of water between the surface of the ocean and the ocean bottom. Processing of Carbon in Arctic Fresh Waters.” Science, vol. 345, no. 6199, 2014, pp. 925–928. ↩︎


Comments