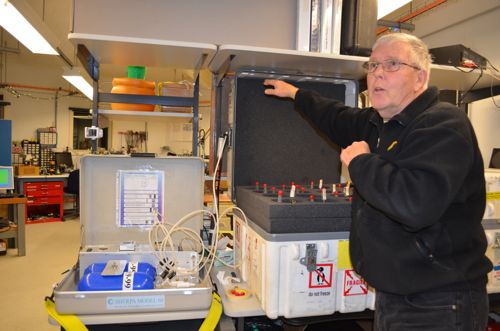
Terra Lab is an awesome place down here at Palmer. It's a building full of impressive machines collecting all sorts of data from tectonic plates to electromagnetic activity beyond the ionosphere. Quick, what are the atmospheric levels around our planet?
A quick guide to atmospheric levels
The one that we enjoy around us is the troposphere. This is where weather happens. Weather is largely determined by changes in air pressure, winds too, but air pressure is the big one. This layer is roughly 14 Kilometers - translated into miles that's about eight and a half. Planes fly in this layer. The stratosphere is next however the these two are separated by a thin region called the tropopause. StratosphereThe layer of the atmosphere above the troposphere and below the mesosphere (between 15 km and 50 km). Click here to see a diagram of the different layers of the atmosphere. so named because it is stratified (remember strata from evolution?) These layers are temperatures. All of these compose the biosphere - bio = life. The area in which life can survive. Bacteria can actually survive in the stratosphere. You shouldn't try it on your own. Bad idea. Above the stratosphere is the ozone layer (about 60 miles up). I know you have heard a lot about that. Thank goodness for this layer. It protects us from UV rays and is a huge factor in the fact that life thrives on this planet. You can check out a previous blog on ozone and Terra lab here http://www.polartrec.com/expeditions/biology-of-antarctic-fishes/journals/2011-05-07.
The mesosphere is just above the ozone layer. Then the uppermost is the ionosphere. This is where lots of atoms are ionized (word roots!!) and where the Aurora is generated (check out blog 1 from this trip). Everyone loves Aurora.
Meanwhile, back at Terra Lab
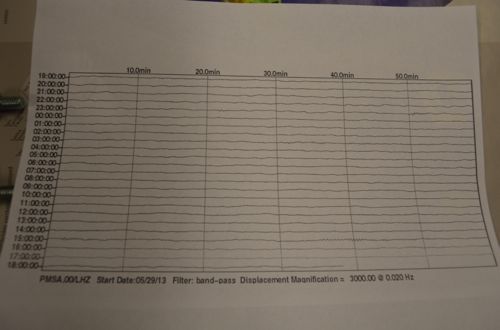
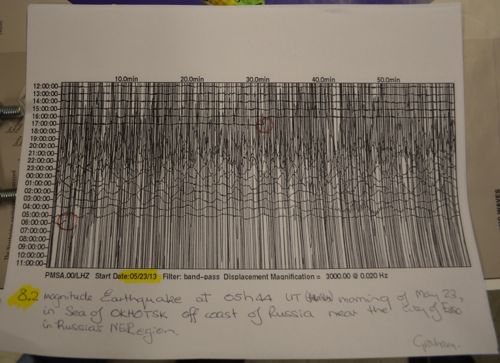
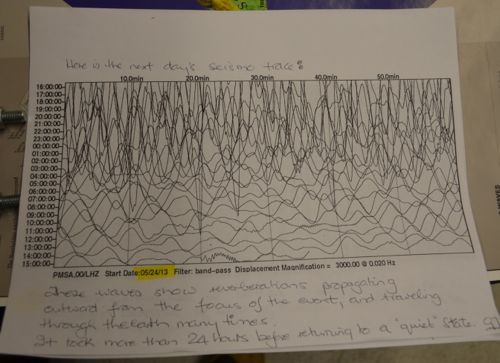
All these levels are under investigation at Terra Lab. Let's start from the ground and work our way up. The seismometer is pretty cool. It picks up ground motion from earthquakes, volcanos, etc. in three ways - North/South, East/West and then on a diagonal. What is so interesting is how far these vibrations travel. In 1994 there was an earthquake in Northridge, California that registered 6.7. Pretty big. It was picked up on the seismometer down here at Palmer Station in only 10 minutes?? Check out the pictures below.
As you might imagine there are instruments measuring the levels of CO2 in the atmosphere. Up in the mesosphere we have a machine to measure the winds and the shifting wavelengths of light, called the Doppler shift, up there. The Fabry-Perot Interferometer or FPI does this. What's great is that we can monitor what is going on above the atmosphere. Sort of like looking down from above instead of up from below. There are some pretty cool light emission phenomena that you can look up. From earth we see lightening which is an electrical discharge. Well high above the lightening, in the mesosphere and lower levels of the ionosphere, you get red sprites and blue jets. Go do some research on these. They are really cool. The Principal scientist studying this down here, Qian Wu, has a website you can visit for more info http://fpi.hao.ucar.edu/index.php He also has some nice pictures from Antarctica and Palmer station on his gallery page. Take a close look at the seventh picture up there. That's me hiking up the GlacierA mass of ice that persists for many years and notably deforms and flows under the influence of gravity.! He was here two years ago when I first came to Palmer.
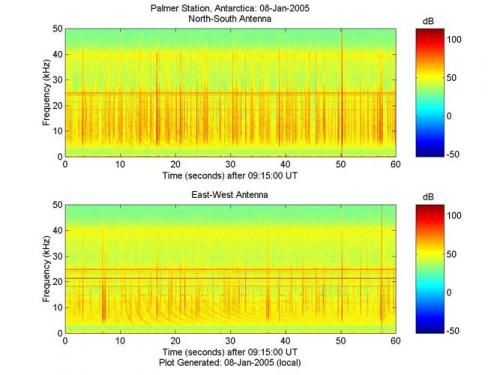
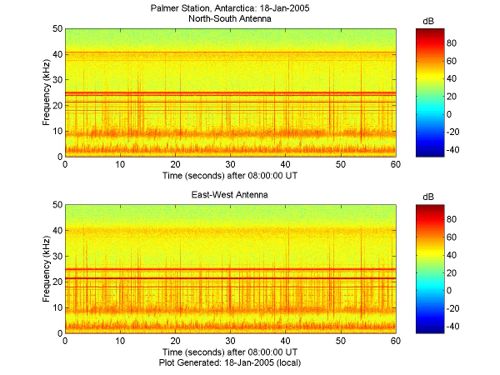
Finally a couple words on VLF (check out my previous blog on this for more http://www.polartrec.com/expeditions/biology-of-antarctic-fishes/journals/2011-05-25) I won't repeat the previous stuff but here's what's new. Basically, the VLF monitor picks up every lighting flash. There are A LOT! But here is the cool part of what happens to that flash and how we can hear it. As the noise from the flash of lightening enters the atmosphere we hear it. Those are the little clicks you hear. Actually, on these would be picked up on some of the am radio frequencies and that's what you hear when you hear the clickety click of the static. Now sometimes this noise enters into the magnetic field and travels, at the speed of light (which is about 186,000 miles per second) out into the ionosphere to a conjugate point from where it originated and all the way back again. When those enter into the atmosphere they give off an eerie long whistler - hence their name of whistlers. Every place on earth has a conjugate point. Palmer Station's conjugate point is the North Atlantic states. I'm including an audio of what is called morning chorus. It sounds like birds, which is why it gets that name.
This VLF recording is call Morning Chorus because it sounds like morning birds.
Listen to the whistlers http://youtu.be/tHeivUI7uSE
Finally, here's something for you to delve deeper into. Elephants. Elephants communicate using VLF as in very low frequency sounds.


Comments