Where are we in relationship with other places in the Northern Hemisphere? Maryland is almost half way around the world from the Bering Sea. Check out the map to see how far the Bering Sea is from the Maryland.
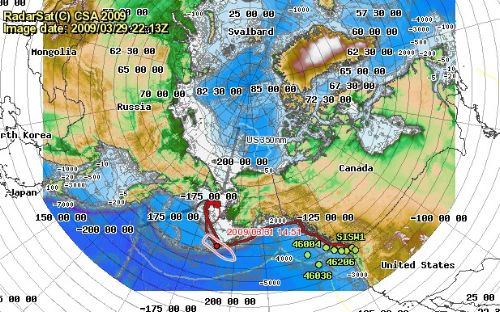
The next map captured as we arrived to Dutch Harbor shows the entire track of our expedition from Kodiak to Dutch Harbor. The white shows ice coverage from a radar image taken on two days earlier.
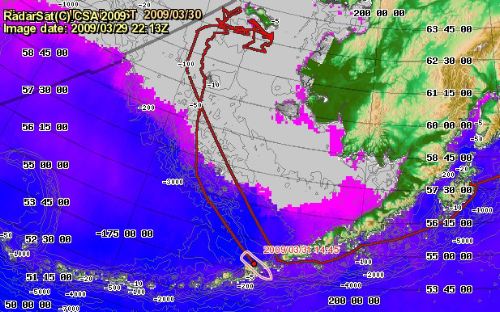
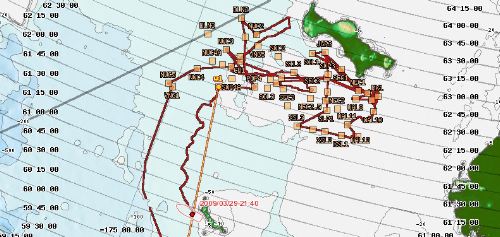
Once in the ice in the Bering Sea, we traveled around as the ice changed to allow as much science to take place as possible. Dr. Lee Cooper was in charge to plan the course of the ship. Each day, the course could change based on winds and ice movement. Check out how we went back and forth. We transected the polynya, the open water, south of St. Lawrence to look for the eiders and other birds. We would stop at stations, which are geographical locations, to do water tests. When we were in the ice, the walrus team was in action along with the ice and the water sampling teams.
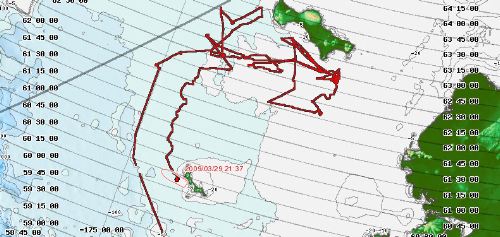
On our way back to Dutch Harbor the winds picked up from the North. You can see how the wind blew the ice south opening up a large polynya south of St. Lawrence Island. This made for slow travel through the packed ice. We lost power for several hours while west of St. Matthew Island. You can see that the ship is facing west towards Russia as we were stopped.
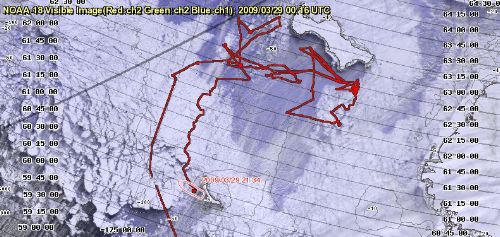
Each square represents a station that we stopped. In past years, other expeditions collected data at these stations. Now the scientists can compare their data to other years. They can then determine how much change has occurred in the region.
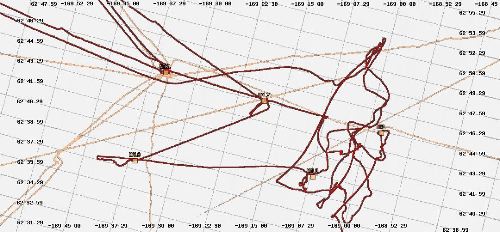
While stopped at a station, the ship's drivers would try to keep us on station but many times the wind would blow or the current would carry us off station. We would have to readjust our postion to continue collecting data. On the next map, you can follow the ship's tract to see the drifting at stations and then the straight return back to station.
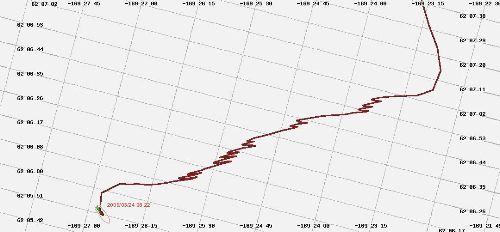
We encountered thick ice on our return. In thick ice, it is hard to find leads, or openings in the ice, to continue to travel forward. In the next map, you can figure out how we traveled in thick ice by ramming and backing.
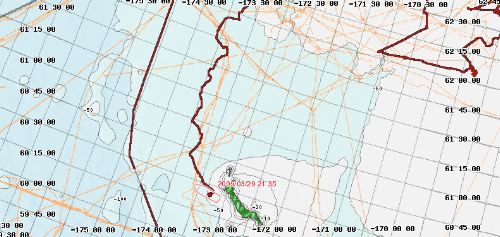
The thick ice made for a jagged ship's track on our return. Compare the northern trip, the line next to the return trip. It is very smooth. Why? In the beginning of our trip, we had open sea as the ice was all blown north. In the open sea, the ship's track is straight. In thick ice, our track becomes jagged as we are ramming and backing and following leads to make our way through the ice.


Comments