Cruise Day 23
Speed 6 knots (kts)
Course 355° (N)
Location Makarov Basin, approx. 164nm S. of the North Pole
Depth 3994 m
GO DEEPER DISCUSSION: (see previous journal for the questions.)
Riddle answer: Ice
TODAY’S JOURNAL:
We are still chugging north, but going a little slower today as we encounter thicker ice and pressure ridges. Still, our North Pole target date of 15 September has been pushed way back- the possibility of reaching the pole within a week is looking pretty realistic at this point. First, we’ll stop this afternoon for a “Super Station.” This stop should last over 2 full days as we take more samples in the ~4000 meter-deep water than we normally do on regular GEOTRACES stations. This is also a crossover station, meaning that the German icebreaker Polarstern will repeat the same measurements at the station coordinates, probably within a few weeks. The Polarstern (“Polar Star” in German) is on a similar cruise to ours, but approaching the North Pole from the Norwegian side of the Arctic Ocean. Crossover stations are designed to have a check in place for both ships, to see if their data is consistent for both ships. If scientists like the data’s agreement on a crossover station, they will have confidence that the results from both cruises can be compared and combined into a larger data set.

We had a little photo quiz yesterday with some safety items. If you want to play along and missed yesterday’s post, click back to the previous journal to try your hand at the game!
Here are the answers:

A throw bag has a length of rope coiled up inside. If someone overboard is within reach, the bag can be unclipped and thrown to them. As the bag flies through the air, rope uncoils out the bag that can be used to pull the victim back towards the ship.

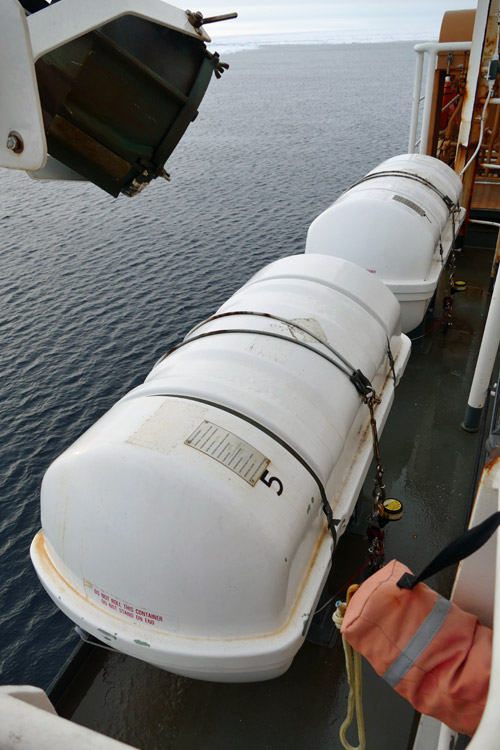
The Healy has several of these canisters mounted on the decks. Each contains an inflatable life raft.

This is a coiled-up fire hose. It flattens out when it is coiled, making storage easier. There are fire hose connections throughout the ship, similar to fire hydrants in a neighborhood. The difference is that the firefighters don’t come from a fire station when called; instead there are members of the ship’s crew trained to deal with fires and other emergencies.

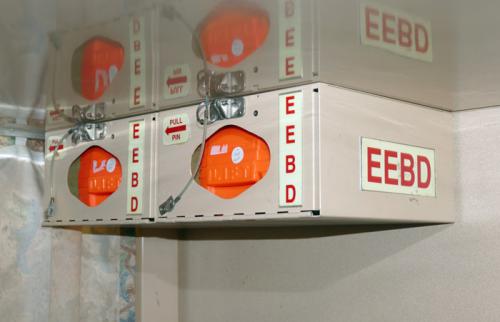
This was probably the toughest one. EEBDs (Emergency Egress Breathing Devices) are located throughout the ship- these two are in the corner of my rack (bunk). They are used to help someone get through smoke or noxious gasses in an emergency, kind of like a single-use gas mask. We were shown how to use them on the first day of the cruise, along with practicing putting on emergency immersion suits, etc.
On a cruise of this length, with large blocks of time transiting between stations, there are other things for members of the science party to do besides collecting samples. Some members of the team work on sample analysis during time between stations, and others work on analyzing their data and working on papers for publication. We also have periodic lectures given by members of the science team. Some of these are of general interest, and coast guard crew members are welcome to attend. Other talks are more specific to GEOTRACES, and attended by just science party members. Yesterday, Mariko Hatta, research affiliate at the University of Hawaii, gave a class on using Ocean Data View (ODV); a data analysis program specialized for physical oceanography. ODV will generate many useful types of graphs and data summaries, a key component of any study or experiment. I’m sure readers of this journal have made many sorts of graphs in their science and math classes- ODV helps oceanographers do the same thing with their research. It is critical to get good data in the first place but equally important to present it in a way that others can understand, so ODV is a key scientific tool seeing heavy use on our cruise.


In this example, the gray ups and downs on the bottom of the top chart represent a sea-floor profile from the Southern Ocean to the Arctic along the center of the Atlantic Ocean. The colors represent phosphate concentrations across latitude (south to north as you go left to right) for various depths (the surface is at the top, with the deepest water nearly 6000 meters deep on the bottom.) The bottom left chart is set up the same way, but represents salinity vs. depth over the same latitude range. The other two charts compare multiple variables such as phosphate and nitrate relationships vs. depth.

In another example, ocean temperature at 300 meters deep is plotted for the Southern Ocean, South Atlantic Ocean, and parts of the Southern Pacific Ocean.
GO DEEPER!
In the second ODV example graph, why are there gray areas indicating no data near the coasts of South America, Antarctica, and Africa? (The gray area is especially wide on the southeast coast of South America.)
Aloft Con web cam updated every hour
That's all for now. Best- Bill


Comments