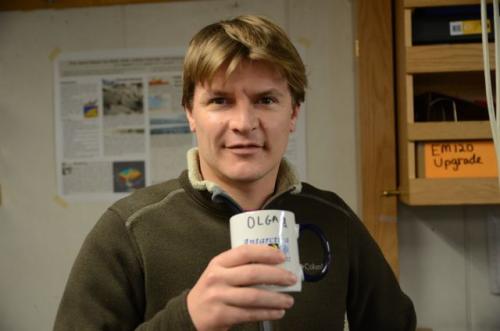
Saturday bring us another great science talk in the Palmer. This time Dr. Thomas Decloedt, from the University of Hawaii, explained the use of the ADCP and LADCP for measuring ocean currents.
When I have written about the ADCP in this journal I have said they measure the currents in the same way the police measures the speed of a car, but I did not explain how it is done. I will attempt to explain here the doppler effect. Again, there are lots of wonderful books that explain this better than I can do here, so I urge you to read them if you end up confused by my attempt.
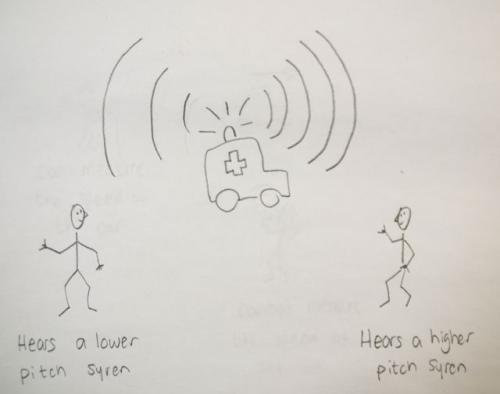
Think about a time in which you were standing on a sidewalk or seating in your car while it was not moving, and an ambulance or fire truck passed by at great speed with its siren on. You probably heard the siren with a higher pitch when it was going towards you than how it sounded when it was moving away from you. That is due to the doppler effect.
The doppler effect happens when there is a source of pulses or waves that is moving with respect to an observer. In the case of the ambulance, the siren is the source of waves and you are the observer. It does not matter if the source moves or you move, in both cases one moves with respect to the other.
We need to define frequency in order to understand the doppler effect. Frequency is defined as the number of pulses or waves that pass by a certain place in a given time. We can talk about your heart's frequency as an example. You count the number of heart pulses in a minute and you get your heart's frequency. If you run for 15 minutes you will see that your heart's frequency increases (more pulses in a minute). Sound is a wave, and we hear the frequency as the pitch of the sound. High frequency means high pitch and vice-versa.
Now imagine you are standing in front of a small pond and that you throw a rock that does not skip to the center of the pond. Ripples will emanate from the place in which the rock landed. The ripples are waves that travel in expanding circles that have a common center, where the rock hit the water. We call 'concentric circles' to circles that have a common center. You can find the frequency of the ripples by counting the number of ripples that arrive to the shore of the pond in a minute. If you were to count the number of ripples that arrive to the shore on the other side of the pond you will find that the frequency is the same as in your side.
Now imagine there is one of those insects that walk on the water surface making the ripples. If the insect does not advance, but still moves its legs, it generates ripples just like the rock did, and you can find its frequency by counting the number of waves that arrive at one point in a minute. This frequency would, again, be the same on both ends of the pond.
The insect is very curious and decides to check you out, so it begins to move towards you and generates the same ripples. The key here is that the second ripple is generated in a spot that is closer to you than where the first ripple was generated. The third ripple is generated even closer to you and so on. The ripples are no longer concentric circles; each circle is embedded on another circle as long as the insect is slower than the waves it generates, but closer to one side of the larger circle than to the other side.
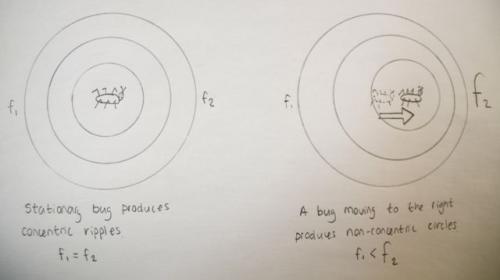
Notice that the distance between two circles is shorter on the side towards the insect is moving than the distance between circles on the back. We will assume that all the ripples travel at the same speed. If we count the number of ripples that get to the shore where you are you will find that there are more ripples per minute (higher frequency) than the ones arriving on the shore on the other side of the pond (lower frequency) in the same amount of time. This means the ripples have a higher frequency on your side of the pond than on the other side, even when the insect generates the ripples at a constant frequency.
All this to say that when a wave source is in motion relative to an observer, the frequency at which the observer perceives the waves is different from the frequency at which waves are generated. When the source is moving towards the observer, the frequency increases, and when it moves away from the observer, the frequency decreases. If we look back at the ambulance example, you hear a higher pitch of the siren when it moves towards you because the sound frequency increases, and you hear a lower frequency when it moves away because the frequency decreases.
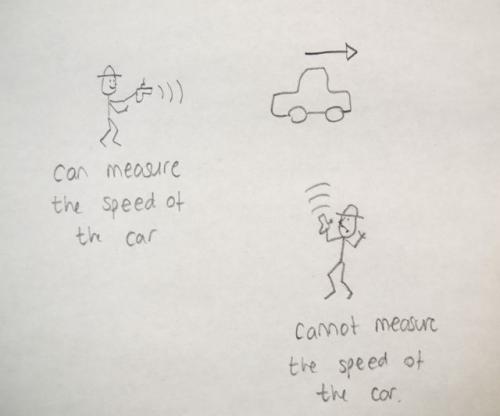
The police can figure your velocity by sending an ultrasound wave at a known frequency towards your car. The waves reflect from your car and the frequency changes depending on your speed. If your car is stopped, the radar gun receives the ultrasound at the same frequency at which it was sent. If you are moving towards the officer, on the other hand, the gun receives the ultra sound at a higher frequency. The difference in frequency between the ultrasound sent by the radar gun and the one that bounced back from your car is proportional to your speed. The officer can use this information to find out your velocity. One limitation of the method is that this works only if the ultrasound beam is parallel to the direction in which the car travels. This means that the radar gun can only measure the speed at which the car is moving towards the gun or away from the gun; it cannot measure the speed of a car that is moving perpendicular to the direction of the gun. That is why police use this guns in parts of the roads that are long and straight.
We finally get back to the ADCP, which stands for Acoustic Current Doppler Profiler (an instruments that measures currents by sending sound waves and measuring the doppler shift on frequency). The ADCP is the radar gun, and for it to work in needs cars to be moving. The cars are anything small floating in mid water that moves with the currents. The fancy name for this is 'scatterers'. Most of them are what Thomas called 'bugs' and biologists call plankton. Thomas said that they have found places in the oceans with so few plankton that the ADCP does not work well because there are not enough scatterers.
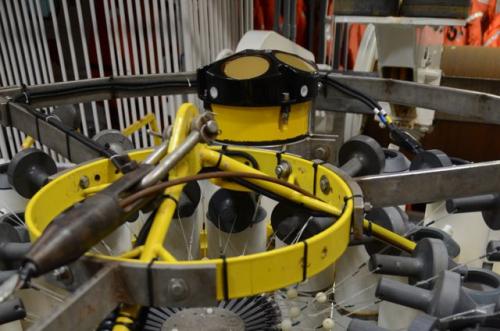
Remember that the radar gun cannot measure the speed of the car when it moves perpendicular to the ultrasound beam. This would mean the ADCP could only measure the speed back and forth in one direction. We solve this problem by placing four 'guns' on the ADCP, called transducers, pointing on four directions. We can then resolve the currents in any direction. The amazing thing about the system is that you can set the ADCP to measure the velocity of the bugs at different distances from the ADCP allowing us to obtain a profile (therefore the name of profiler). This means that we can measure the currents at different depths! Fantastic, don't you think?
The LADCP stands for Lowered ADCP. This is an ADCP that is attached to the rosette and measures the currents along the 4500 meters of depth that our rosette travels. That is even better than the ADCP that is attached to the boat. It is a bit more complicated to get the currents from the LADCP because the LADCP is also moving. We need to somehow remove the motion of the rosette so we can isolate the motion of the currents. It is better two have to LADCP on the rosette, one pointing to wards the surface and another towards the bottom. Thomas can use the data from both LADCP and the ADCP from the ship to get the velocity of the currents.
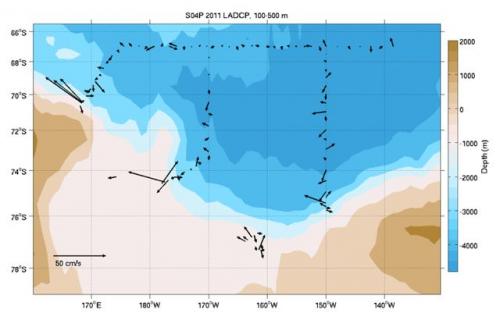
Thomas showed this image of the current averages between 100 m and 500 m of depth and another one of one of the sections we have done. His data generated more scientific questions that we hope will be able to resolve with the data from Alex's moored current meters that we recovered.
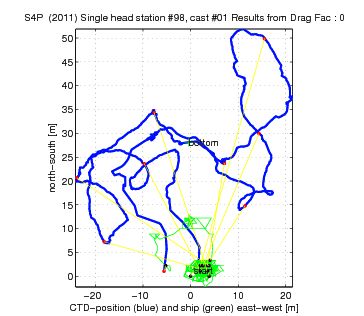
One really neat thing shown by Thomas is that he can also resolve the horizontal motions of the rosette during the cast He showed us this image from one of our casts. You can see where the rosette left the boat, the big circles that it made and where it ends back on board.
ADCP para medir corrientes
El sábado nos trajo otra gran charla científica. Esta vez fue el turn del Dr. Thomas Decloedt de la Universidad de Hawaii, quien noes explicó el uso del ADCP y LADCP para medir corrientes.

Cuando he escrito sobre el ADCP en este diario simplemente he dicho que mide as corrientes oceánicas del mismo modo en el que la policía determina la velocidad de tu coche con una pistola de radar, pero no expliqué como funciona el método. Intentaré explicar el efecto doppler. Una vez más diré que hay muchos libros de texto que explican el fenómeno mejor de como lo puedo explicar aquí, así que te invito a que leas uno de esos textos si te confunde mi intento.
Piensa en alguna vez que hayas estado en la acera o dentro del coche sin que se mueva, y que haya pasado zumbando una ambulancia o camión de bomberos a toda velocidad con la sirena prendida. Probablemente escuchaste el sonido de la sirena con un timbre más alto cuando la ambulancia se acercaba a tí y con un timbre más bao cuando se alejaba. Eso se debe al efecto doppler.
El efecto doppler ocurre cuando el generador de ondas o pulsos se mueve con respecto al observador. En el caso de la ambulancia, la sirena es el generador de ondas y tú eres el observador. No importa si la ambulancia se mueve hacia tí o tu te mueves hacia la ambulancia, en ambos casos se mueve uno respecto al otro.
Necesitamos definir lo que es la frecuencia para poder entender el efecto doppler. Frecuencia se define como el número de pulsos o de ondas que pasan por un cierto lugar en un tiempo determinado. Podemos hablar sobre la frecuencia de tu corazón, por ejemplo. Si cuentas el número de pulsos cardiacos en un minuto obtienes la frecuencia de tu corazón. Si sales a correr 15 minutos y te tomas el pulso de nuevo, verás que la frecuencia habrá aumentado (más pulsos por minuto) El sonido es un tipo de oda, y su frecuencia la escuchamos como el timbre. Alta frecuencia significa timbre alto y viceversa.
Ahora imagina que estás frente a un pequeño estanque y que tiras una piedra al centro del estanque sin que salte en el agua. Se generarán pequeñas olas en el sitio en el que calló la piedra. Estas ondas se propagarán en forma circular, y estos círculos tendrán un mismo centro, que es donde cayó la piedra. A los círculos que tienen un mismo centro se les llama círculos concéntricos. Puedes encontrar la frecuencia de las ondas al contar el número de ondas que llegan en un minuto a la orilla en la que estás. Si contaras el número de ondas que llegan a la orilla opuesta verías que la frecuencia es la misma.
Ahora imagina que hay uno de esos insectos que caminan sobre el agua haciendo ondas. Si el insecto no se desplaza, pero mueve las patas y hace ondas en el mismo lugar, generará ondas como las que generó la piedra. La frecuencia vuelve a ser el número de ondas que llegan a un sitio en cierto tiempo, y será la misma en cada orilla del estanque.
El insecto resultó muy curioso y decide observarte desde una distancia menor, así que comienza a desplazarse hacia donde tú estás. El insecto va generando olitas mientras se dirige hacia ti. La clave está en que genera la segunda ola en un punto más cercano a ti del sitio donde hizo la primera ola. La tercera ola será generada todavía más cerca, y así sucesivamente. Las ondas se propagarán en círculos otra vez, pero éstos no serán concéntricos. Cada círculo estará dentro de otro más grande mientras el insecto avance más lentamente que las olas, y cada círculo estará más cargado hacia un lado del círculo grande.

Verás que la distancia entre dos círculos adyacentes es menor del lado hacia el que se dirige el insecto que el lado opuesto. Supondremos que todas las ondas se desplazan con la misma rapidez. Si contamos el número de olas que llega a tu orilla en un minuto verás que serán más de las que llegan a la orilla contraria. La frecuencia de las olas es mayor de tu lado que del otro, aún cuando el insecto genere las olas con la misma frecuencia.
Todo esto para decir que cuando un generador de ondas se mueve respecto a un observador, la frecuencia con las que llegan las olas al observador será diferente a la frecuencia con la que las olas fueron generadas. Cuando el generador se acerca al observador la frecuencia aumenta, y cuando el generador se aleja del observador, la frecuencia disminuye. Podemos entonces explicar el ejemplo de la ambulancia. Escuchas un timbre más agudo cuando la ambulancia se acerca a ti que cuando se aleja porque la frecuencia es mayor cuando la ambulancia viaja hacia ti que cuando se aleja.

La policía puede medir tu velocidad al mandar ondas ultrasónicas de frecuencia conocida hacia tu coche. Las ondas se reflejan en tu coche y la frecuencia cambia dependiendo de tu velocidad. Si tu coche está parado, el radar recibe las ondas de ultrasonido a la misma frecuencia con las que fueron enviadas. Si por otro lado tu coche va en dirección del policía, la frecuencia aumentará. La diferencia en frecuencia con que el ultrasonido es enviado y recibido es proporcional a la velocidad de tu coche, y el policía puede usar esta información para calcular tu velocidad. Una limitación del método es que solo funciona si el coche se mueve en la dirección en la que se envía el ultrasonido. Es decir, que el policía sólo puede calcular tu velocidad si vas hacia él o te alejas de él (policía de la izquierda en el dibujo inferior), pero no puede calcular tu velocidad si vas en dirección perpendicular a la dirección en que se envía el ultrasonido (policía debajo del coche). Es por esto que la policía usa estas herramientas en trozos de la carretera que son largos y rectos.

Finalmente llegamos al ADCP, que significa perfilador acústico doppler de corrientes (Acoustic Current Doppler Profiler) o instrumento que calcula la velocidad de las corrientes a diferentes profundidades mediante el uso del efecto doppler y ondas de sonido. El ADCP es como la pistola de radar del policía, por lo que para funcionar necesita que haya coches en movimiento. Los coches serán cosas pequeñas que est´n flotando a media agua. La mayor parte son lo que Thomas llamó 'bichos y que los biólogos llaman plancton. Thomas dijo que han intentado usar el ADCP en zonas en las que hay pocos bichos y el ADCP no funciona.

Recuerda que la pistola radar no puede medir la velocidad del coche cuando este va perpendicular al tiro de la pistola. Esto querría decir que el ADCP sólo puede medir la velocidad en ambos sentidos de una única dirección. Resolvemos este problema colocando cuatro 'pistolas radar' en el ADCP, que llamamos transductores, que nos permiten medir las corrientes en cualquier dirección. Lo que es asombroso es que el sistema puede medir la velocidad de los bichos en el agua a diferentes distancias del ADCP, lo que nos permite obtener un perfil de corrientes (de ahí el nombre). Fantástico, ¿no te parece?
El LADCP es un ADCP que va fijo en la roseta cuando vaja al fondo (la L significa Lowered, que baja). El bajar el LADCP nos permite ver las corrientes desde la superficie hasta el fondo. Es un poco más complicado el procesar los datos del LADCP que del ADCP por el movimiento de la roseta. Para solucionar el problema Thomas pone dos LADCP en la roseta, uno mirando a superficie y el otro para abajo. Además usa los datos del ADCP del barco para aislar las corrientes oceánicas
Thomas nos enseñó una imagen con el promedio de las corrientes entre los 100 y 500 metros de profundidad y otra con el perfil de las corrientes a lo largo de un o de los transectos que hemos hecho. Las imágenes generaron más preguntas científicas que esperamos se puedan resolver con los datos de los correntímetros que Alex rescató de los fondeos.

Otra de las cosas que se ven con los datos es el movimiento horizontal de la roseta al bajar hasta el fondo. En esta imagen se ve que la roseta no baja en línea recta. Se ve la posición en la que deja el barco, las espirales que hace y el sitio en el que regresa a cubierta.


Comments