Today’s Journal
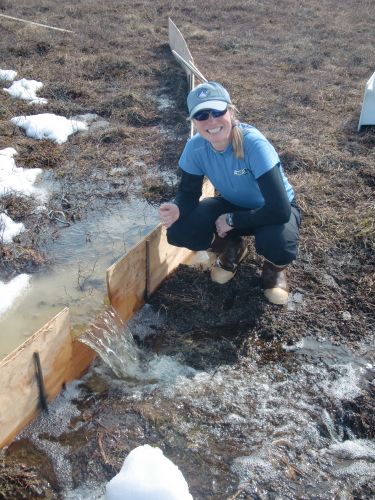
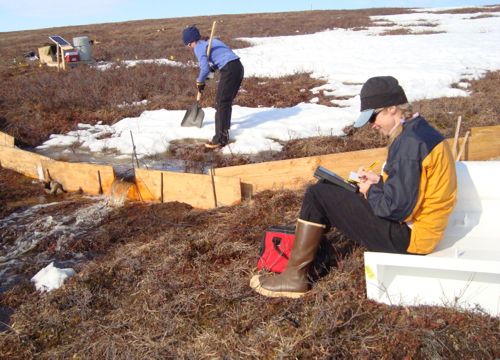
The daily temperatures have been in the high 40’s and 50’s (F) over the last week, yet still only one of our sites has melted out enough to see the flow coming over the weir. The weir is made of plywood boards buried in the ground that were installed in the fall when the active layer was thawed.

At the other sites, the weir is still mostly buried in snow. I have actually been surprised at how slowly the other sites are melting out. We have been continuing our snow depth surveys and there is still a good amount of snow persisting in the water tracks. We measured snow depths of 30 to 60 cm inside the water tracks on two of our sites yesterday.
Dilution Gauging
Where we do have flow (only in water track 4), we are taking water samples once per day and dilution gauging in the early afternoon and evening.
Dilution gauging is used to estimate instantaneous discharge. We also call this process “slugging” because we use salt slugs (about 90 grams/liter of NaCl). We quickly dump a salt slug of a known volume (typically 120-130ml) into the flowing water upstream of the weir. Then use a probe to measure the conductivity every second until we return to the background conductivity. Depending on flow rate this process can take a couple of minutes up to about 20 minutes. Conductivity is the ability of the water to carry a current, which depends on concentration of dissolved ions.


Then we use a little math to help us figure out the discharge. Our equation might look familiar to some of you: C1V1 = C2V2 where C=concentration and V=volume.
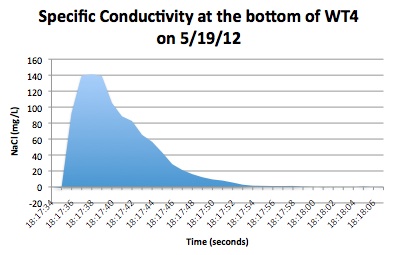
We know C1V1 which is the salt slug and figure out C2 by calculating the area under the time vs. conductivity curve and then solve for V2 (volume of stream flow passing the probe). The image below shows a graph from one of our dilution gaugings to help us figure out V2.

So far we have gotten discharge at the bottom of the water track of 12 to 14 liters/sec in the afternoon. In the morning our bottom discharge was 7 liters/sec and at the top it was about 2 liters/sec. Clearly you can see that afternoon discharge is greater, which is not surprising. The top vs bottom measurements tell us that there is a lot of flow gained in-between the top and bottom.
Question to Ponder
This is one of the instruments that we carried out and set up at one of our sites yesterday. Any ideas what this instrument does? Check back soon for the answer.


Comments