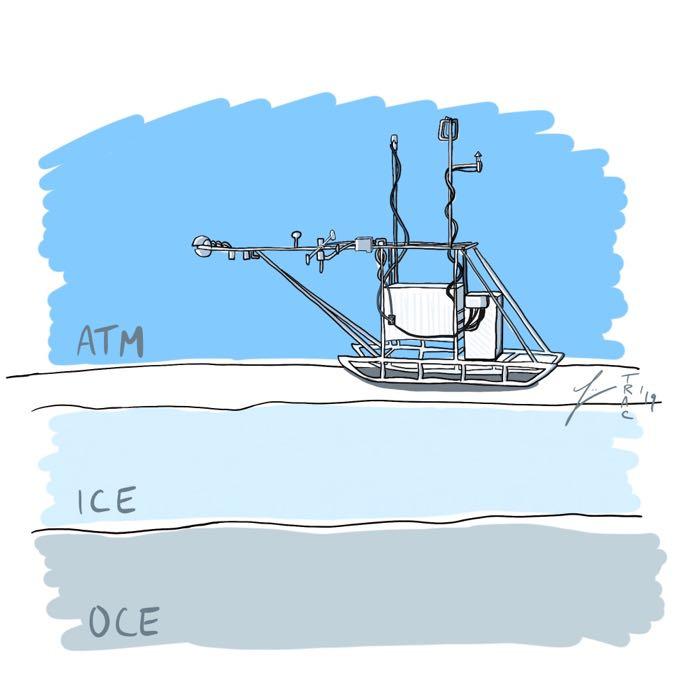
During MOSAiC Leg1a aboard the Akademik Fedorov, I was lucky to help install three arrays of meteorological equipment on the sea ice. Special meteorological sleds were designed by researchers and engineers from CIRES, the University of Colorada, and NOAA. They are officially called meteorological and atmospheric surface flux stations (more on that later), but we usually referred to them as met sleds or, jokingly, the hearses.
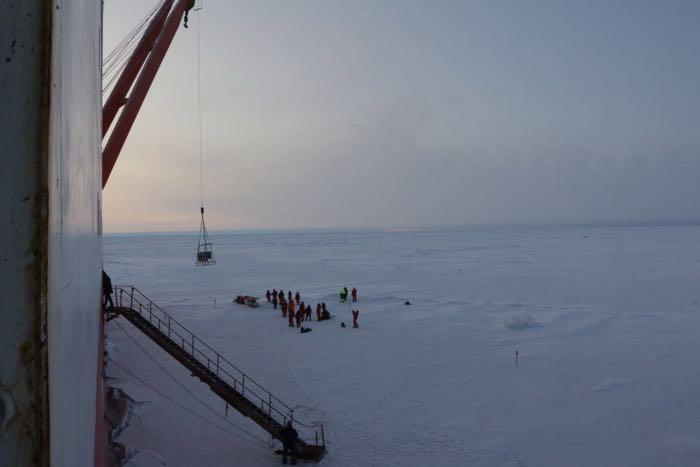
There are three of them; each one is set up on one of the L-sites. The met sleds were created specifically for the distributed network of the MOSAiC Expedition. Each sled weighs about 600 pounds! They were built so that a wide range of meteorological and atmospheric sensors could be mounted on the sled to collect data. Built with custom-made runners, the sleds can be transferred by a crane onto the sea ice and then pulled into place on the ice floe by a snowmachine. It can even be pushed by people. When the snowmachines were busy, four of us were able to easily push the sleds across about 100 meters (330 feet) of fairly smooth snow and sea ice. It is a pretty cool set up!
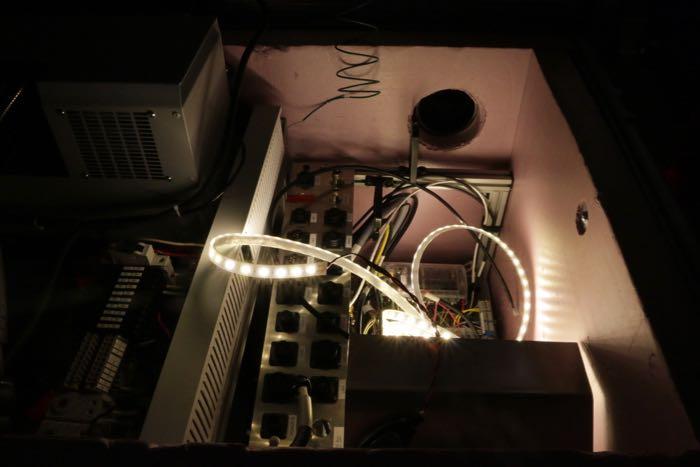
The sleds also contain equipment for storing data and transmitting that data back to the Polarstern. Both Iridium (satellite phone) and radium transmission is utilized. Every sensor on the sled, and especially the data storage and transmission, requires electricity. So each meteorological sled also contains an EFOY fuel cell. The fuel cell combines methanol and oxygen from the surrounding air to produce electricity. The waste products are heat, water vapor, and a small amount of carbon dioxide. The creation of heat as a waste product is actually beneficial in harsh winter conditions in the Arctic, as it can be used to keep the data storage equipment at a reasonable temperature. Water vapor and carbon dioxide can be a bit more of a problem, since those are among the many things sensors on the met sled are trying to measure. The researchers have to be careful they aren't just measuring the "breath" of their own equipment!
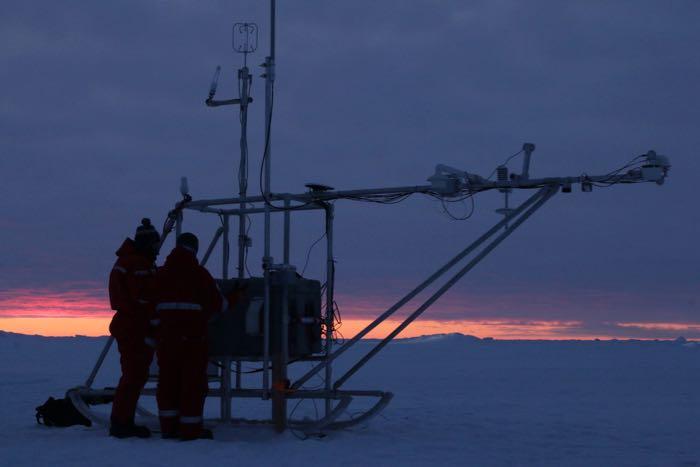
So what exactly are these massive, movable met sleds measuring? A long boom extends from the front of the sled. This puts some distance between the sensors and the main body of sled (including the EFOY exhaust and the area people will disrupt for monthly maintenance). At the end of the boom, a radiometer measures shortwave radiation (solar radiation, visible light) coming down from the atmosphere and up from the sea ice surface, as well as longwave radiation (infrared radiation) emitted from the sea ice surface and coming down from the atmosphere. This information is incredibly important for understanding the energy budget in the Arctic atmosphere. Changes in the Arctic energy budget can have massive influence on sea ice, ocean currents, weather, and climate -- both in the Arctic and beyond. I will discuss the impacts of clouds and albedo on this energy budget in a future journal, but suffice it to say that the energy budget is very complicated and very important to understand.
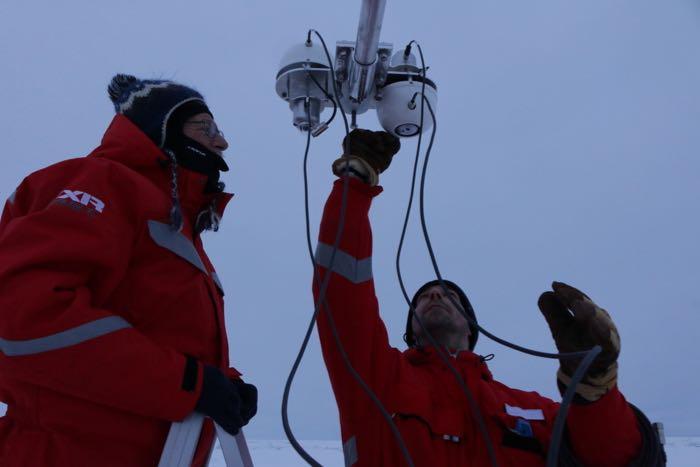
The sun emits shortwave radiation. This radiation contains a lot of energy. Some is reflected, refracted, or absorbed by the atmosphere. But much of the shortwave radiation is absorbed by the surface of the Earth. Some of this energy is converted through other processes in the Earth, and some is re-emitted by the Earth as lower-energy longwave radiation. A portion of this longwave radiation escapes Earth's atmosphere into space, but much of it is absorbed by clouds and gases in the atmosphere and then radiated back to Earth's surface. This is what the radiometer measures as incoming longwave radiation. The interaction between incoming shortwave radiation, and outgoing and incoming longwave radiation describes the Greenhouse Effect. The greenhouse effect is very important to life on Earth, as it keeps our temperatures in a range that is habitable for a diversity of life forms; however, climate change is strengthening the greenhouse effect with significant consequences across the planet. This short explanation from the University Corporation for Atmospheric Research may be helpful.
Next to the radiometer, there is a sonic ranger. This bounces sound off the surface of the snow to measure the height of the snow surface. Initial snow measurements, taken the old fashioned way with a meter stick, are combined with this information to determine snow depth over time. Nearby, an infrared thermometer measures the brightness of the snow surface to help scientists track and understand changes to albedo over the course of the seasons and different weather events.
The boom also includes a GPSA Global Positioning System (GPS) is a satellite-based navigation system used to track the location or position of objects on the Earth’s surface. sensor that measures not only location, but the angle of the sled compared to the Earth's surface and the heading the boom is facing (direction, relative to North). There are also two webcams aimed at the instruments, transmission equipment, and fuel cell intake and exhausts. These cameras allows researchers to observe changes that might require maintenance and double-check that the sensors in the instruments are not getting covered with frost, rime, or icicles. This could interfere with the measurements.
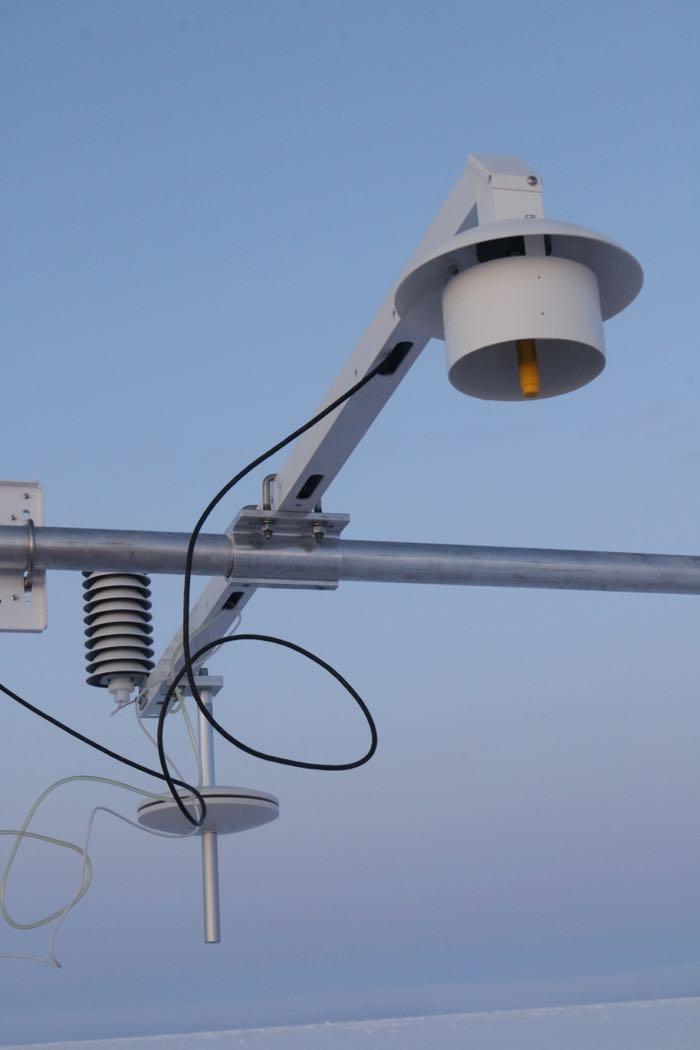
Next on the boom, the basic meteorological package measures temperature and humidity. Humidity measures the mass of water vapor compared to the mass of dry air in a given volume of air. Because humidity is really difficult to measure at low temperatures, part of this instrument actually warms the air before measuring the humidity. Then, the temperature data (from the unwarmed air) and humidity data can be combined to determine relative humidity. Because air can hold more or less water vapor depending on air temperature (hot air has the capacity to hold more water vapor than cold air), relative humidity tells you the ratio of the current absolute humidity to the highest possible absolute humidity. How much more water vapor, at the current air temperature, can the air have before it is totally saturated? This information is important for understanding precipitation patterns in the Arctic, as well as cloud and fog formation, and phenomenon like frost and rime formation. This information from the National Snow and Ice Data Center provides a nice overview of humidity, as well as other factors influencing Arctic weather and climate.
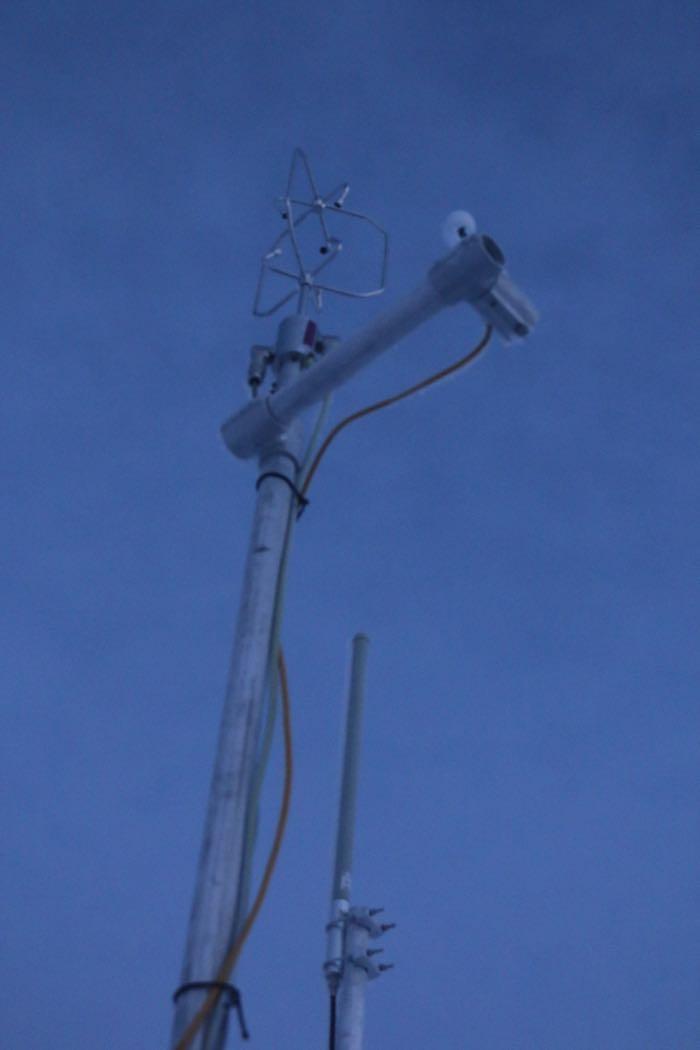
Closer to the body of the sled, an arm extends 3.5 meters from the ground. A 3-dimensional sonic anemometer is mounted at the top of this boom. Anemometers are typically used to measure wind speed and direction. This one does measure surface winds, but it is also much more sensitive. The 3-dimensional design allows it to measure small-scale fluxes (movement) of air in all directions. This is especially useful for understanding how air moves up and down near the boundary between the ice and atmosphere. Because these small-scale eddies and fluxes of air can transport heat and moisture, they influence the local formation and melting of sea ice as well as the weather processes in the atmosphere. Nearby, a Licor gas analyzer measures carbon dioxide and water vapor in the air.
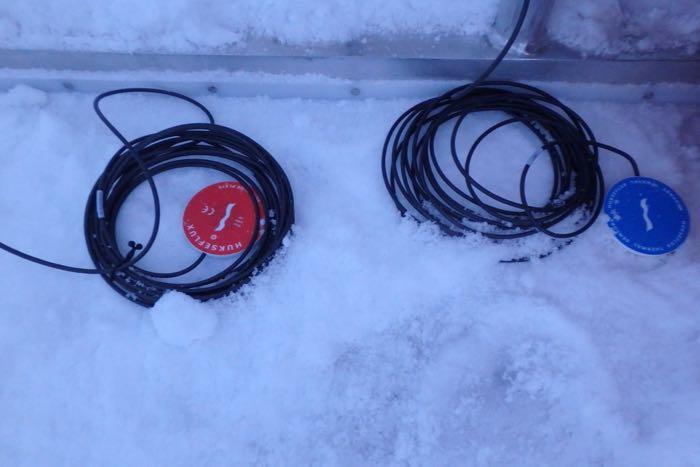
Small flux plates are buried under a few inches of nearly undisturbed snow. These are designed to measure the flux of heat energy up and down through the surface of the snow.
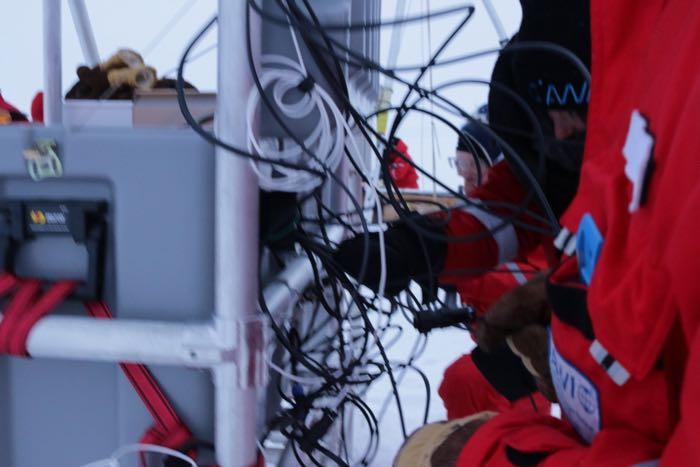
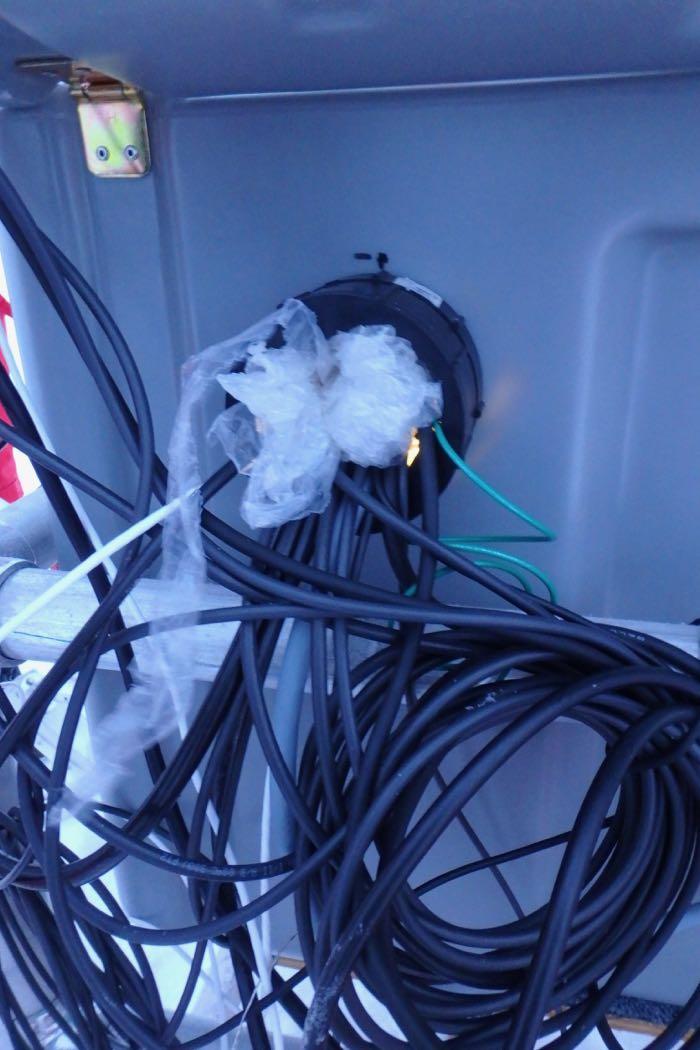
As you might imagine, setting up this array of instruments on the sea ice came with many challenges. Hopefully, and with regular maintenance from a dedicated crew of researchers and engineers, all of these instruments will collect data over the course of a year as sea ice conditions and seasons shift. The sleds complement atmospheric research taking place closer to Polarstern through meteorological towers at the ice camp, LIDAR instruments and radiometers and aerosol sensors on the ship, and weather/atmospheric balloons. This information will also be informed by nearby oceanographic and sea ice buoys. Taken together, the data will be incredibly valuable to researchers trying to understand coupled atmospheric-sea ice dynamics in a changing Arctic.
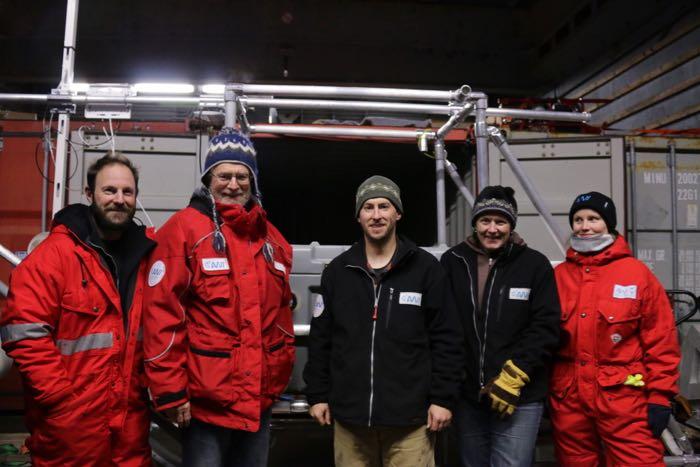
I am very grateful to have been welcomed by the met sled team. I learned so much through the process, especially since my background is much more on the ecology and to a lesser extent oceanography side of things. Atmospheric science is a whole new, fascinating world for me! Special thanks to Chris, Dave, and Ola for being willing to explain (repeatedly) all the nuances of the instruments and set up and for sharing their scientific insights with me. Appreciation to Anne Gold who served as my connector and worked diligently to find ways to involve me and get me up to speed!
MOSAiC Updates Actually, right now is an exciting time! The first round of data from the met sleds (and other MOSAiC instruments without real-time online data access) will soon be headed back to the shore. Leg 1 of the MOSAiC Expedition is coming to a close and Leg 2 is beginning. This week, when weather and ice conditions allow, nearly 100 people are changing places. About 50 researchers, engineers, and logistics support people currently aboard the supply vessel Kapitan Dranitsyn will transfer over to the Polarstern, along with resupplies and specially requested replacement parts. In return, about 50 people will move to the Kapitan Dranitsyn for the transit home. Among the many things they carry with them will be precious, high resolution data that could not be transmitted back to shore for various reasons. I'm eager to get a glimpse at the data collected by the met sleds and other instruments I observed on the L-sites!
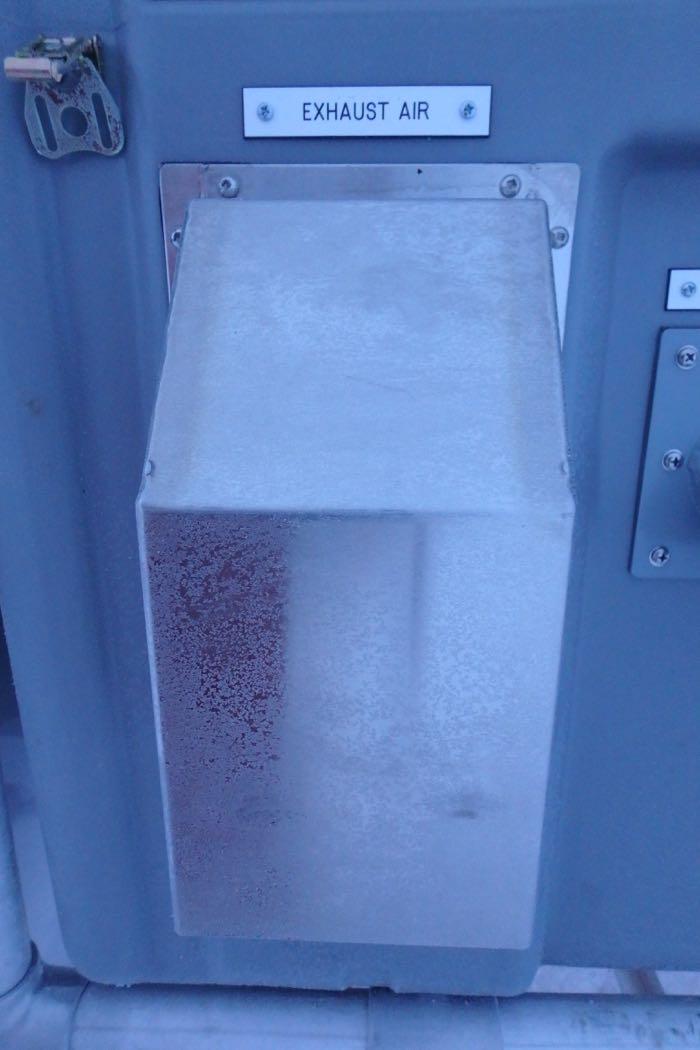
Not everything has gone smoothly with the instruments and logistics, but I'm sure it will be rewarding for the scientists to see the data that could be collected. It is a truly monumental effort, and the amount of relevant data is impressive, even with some hiccups. One of these hiccups is a really interesting story. About a month ago, the data coming to Polarstern from the met sled on the L-2 site suddenly stopped. Matt Shupe, leader of the Atmosphere Team and a co-leader for the MOSAiC Expedition, examined all of the available information from the 10 minutes before the data stopped transmitting. There were some clues. First, the inclination (angle) of the met sled changed significantly. It tilted about 3x as much as it had when Matt and his colleague Dave Costa had stood on the sled for maintenance earlier in the month. The sonic anemometer, which extends above the met sled and relies on a system of power cables and data cables, quit. Then there were two major spikes in the longwave radiation sensed by the radiometer. What do all these clues add up to? Matt's guess was a polar bear, and the evidence was strong when the visited the site by helicopter. It appears a polar bear climbed on the sled, ripping a cable to the anemometer before breaking additional cables and connectors including those needed to transmit data. Finally, the bear seems to have become interested in the exhaust from the EFOY fuel cell. Remember this creates water as a waste product? Perhaps the bear was interested in those drops of water. Whatever the reason, the bear sucked on the exhaust pipe, eventually ripping the exhaust system off, damaging the copper tube, and chewing on a heat cable. Three weeks later Matt and Dave travelled back by helicopter to the L-2 site and were able to complete major repairs and the L-2 met sled is live again!
Education Extensions I find it really exciting to think about ways students and community members can collect basic meteorological and atmospheric data in their backyards or schoolyards that parallels the data collected by MOSAiC scientists using sophisticated instruments in the Arctic.
The GLOBE Program is a NASA community/citizen science opportunity that uses on-the-ground measurements from classes and people around the world to ground-truth remote sensing by NASA satellites. This information is especially important for more remote locations where it can be hard to find local data to compare with satellite sensing. In many ways, much of the data collected through MOSAiC will be used similarly to improve remote sensing used by a lot of different satellites. Once you are trained, your students can follow specific protocols to collect and submit data about temperature, humidity, and other atmospheric, soil, and water characteristics. The Community Collaborative Rain, Hail, and Snow Network - or CoCoRAHS - is another great community science program that encourages volunteers across the U.S. to measure and submit precipitation information.
The Arctic ClimateThe average weather over a particular region of the Earth. Climate originates in recurring weather phenomenon that result from specific types of atmospheric circulation. Modelling Program, through the Geophysical Institute of the University of Alaska Fairbanks, has an excellent curriculum related to Arctic climate and atmospheric processes. It is designed especially with rural Alaskan schools in mind, so activities tend to use easily accessible materials rather than specialty products difficult to obtain in remote places. The curriculum also strives to integrate Indigenous Knowledge systems, especially practices around weather observation and predictions. Despite the specific focus on rural Alaska, many of the lessons are useful across geographic context and many of the more place-based and culture-focused lessons could be adapted in really interesting ways for other locations. Students can build a psychrometer and use it to measure humidity. Other lessons include broader weather observations, learning about traditional methods of weather prediction, and working with climate change data and stories.
Your class can also track basic conditions, like air temperature and day length, for the Arctic. Polarstern data is available each week to teachers through MOSAiC Mondays. They even provide a template for graphing the information! If your class collects data on air temperature or day length over time, you can compare this with conditions around the Polarstern. You could also use the GLOBE data visualization system to find air temperature data from all over the world.


Comments