Obsessed With Maps
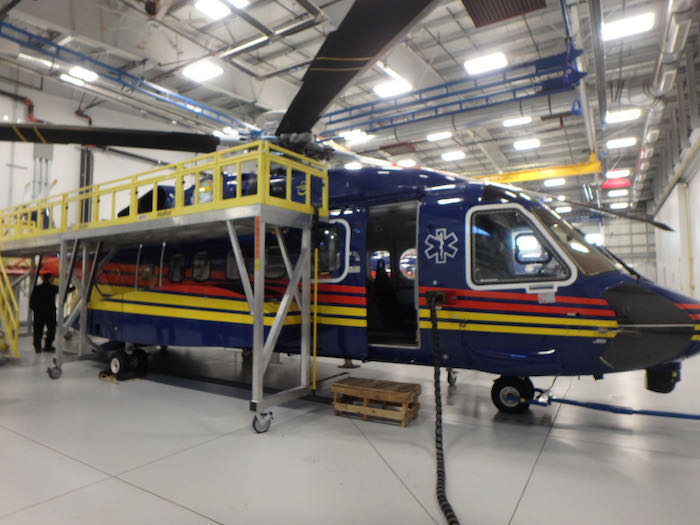
Our team spends significant time studying the most current satellite imagery available every day. Imagery comes from the US National Ice Center*, Sentinel, Landsat, IBCAO, RADARSAT*, and is made available to view in various file types that we can open in ArcGIS and Google Earth. We are studying the position, age, and character of the sea ice through these maps so that we can find ideal locations to deploy buoys. We also have to account for how far the helicopter pilots can and are comfortable flying as well as how far of a range (roundtrip) we can go (amount of fuel). Through a partnership with the North Slope Borough Search and Rescue team, their pilots fly their helicopter for our team over the sea ice to deploy buoys more than 50 miles out from the coast.

Our IABP team comes to Utqiaġvik at least a couple times a year to deploy buoys and maintain the buoy test site. Most years we are able to get far out on the sea ice from the beach on snow machines using the local whaling trails. This year, due to sustained high winds creating unrelenting snow drifts, the whaling teams have not yet cut the trails through the jagged sea ice very far off the coast to the edge of the lead (open water). So, we have not been able to get very far out to deploy new buoys via snow machine.
The sustained high winds (approximately 25mph) for 24 hours a day for the last week or more, has caused the sea ice to shift significantly rather quickly. The maps we were studying last week are nearly obsolete for our mission as the sea ice has moved so much. You can see the movement from the past two weeks on this NASA World View animation.
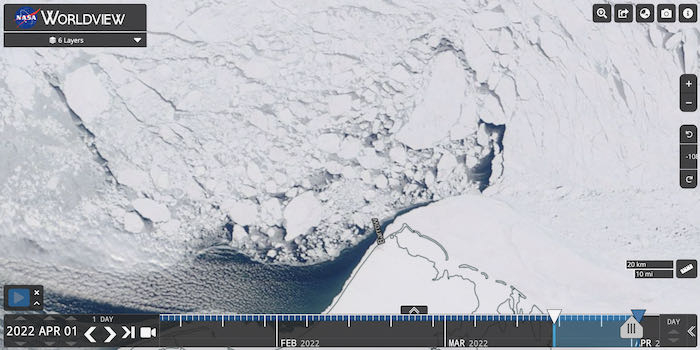
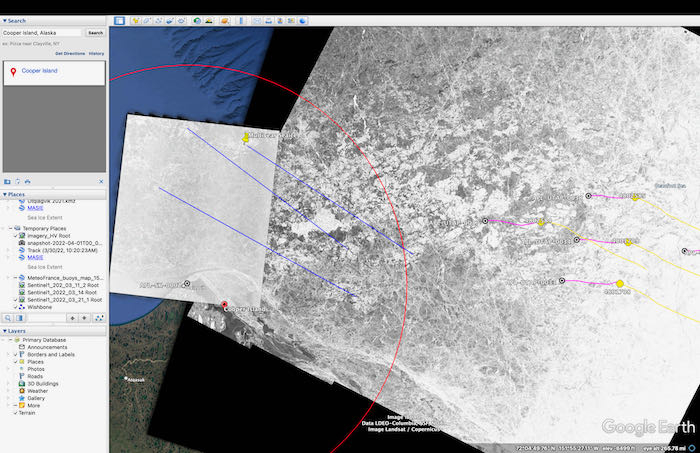
*RADARSAT-2 Data and Products MDA Geospatial Services Inc.(2020) - All Rights Reserved. RADARSAT is an official trademark of the Canadian Space Agency.
Tomorrow's Plan
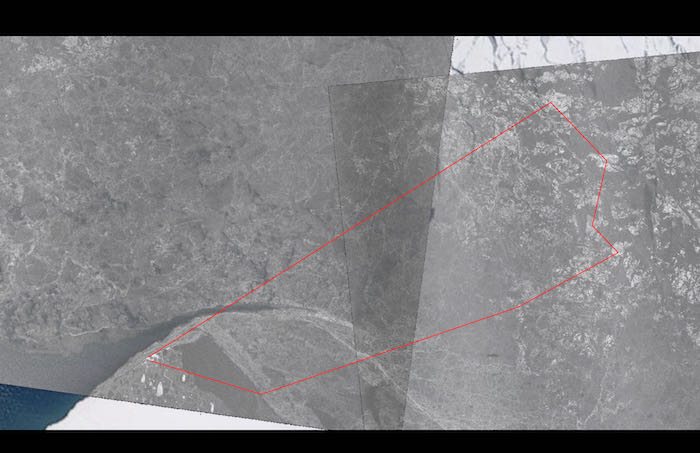
Our team uses very high resolution map images from the various satellites and radar sources and stacks them (layers) on top of each other using ArcGIS and Google Earth tools to integrate all the data we have. Then, we can analyze the data (map images) to determine where we want to deploy buoys.
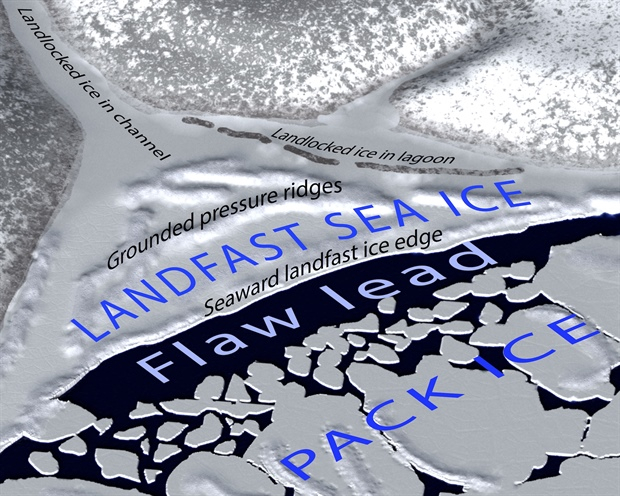
A Bit More About Sea Ice
Engage with IABP AK Spring 22 Deployment Expedition
- Subscribe to these Journals by Email on PolarTREC virtual basecamp page
- Write in questions and comments at the bottom of journal entries
- Watch and listen to KWBR radio interview
- Participate in April 5 PolarConnect live stream event at 9:00 am (mountain time)
- Follow on Instagram @Wild_Rose_Education
- Follow on Facebook @WildRoseEducation
- Follow #ArcticRuminations on other social media channels


Comments