What can studying the mud tell us about climate change and the behavior of the glaciers?
It's time to step back a little and go a little deeper into the science of sedimentology (mud science).
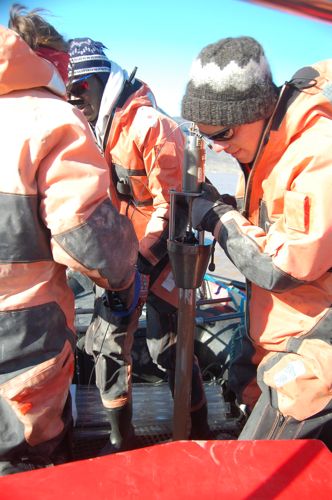
The team has been sampling the sediments in three ways – sampling water, sampling the surface mud (through box cores) and sampling the deeper layers (through gravity cores). Collecting these samples is a physically demanding and time-consuming process. So why go through all this effort?
For an overview of how the water sampling process works, you can read my previous journal entry here: http://www.polartrec.com/expeditions/high-arctic-change-2011/journals/2011-07-22
For an overview of how the box coring process works, you can read the journal entry here written by Liz Ceperley here: http://www.polartrec.com/expeditions/high-arctic-change-2011/journals/2011-07-25
For an overview of how the gravity coring process works, you can read my previous journal entry here: http://www.polartrec.com/expeditions/high-arctic-change-2011/journals/2011-07-26
Surface Mud: Where is the mud coming from?
Liz's project is centered around the surface sediments we've been collecting. The main question she's looking at is where does the mud come from and where does it go once it enters the fjord?
Liz has been processing her samples to take home in a few ways. First, she collected water samples that contain suspended sediments. She has been vacuum filtering these samples to get the sediments out of the water. The little system she has set up basically pulls the water through a filter, leaving the sediments behind. Different filters have holes of different sizes, so she has to choose the correct filter – if the holes are too big she'll lose the sediment, but if they are too small the filter will clog up.
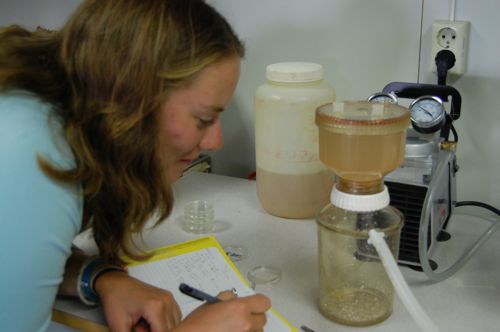
You can see from her dried filter samples that there are some real differences in color. This can indicate that there are different minerals present in different areas. When she combines this with other data, she will be looking for patterns of where certain minerals are observed.
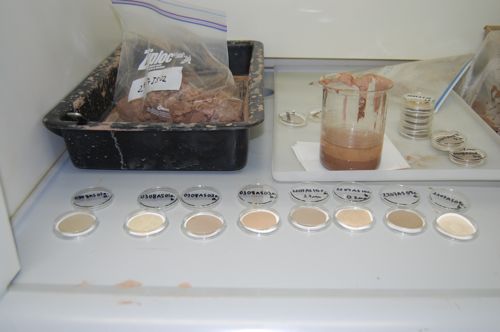
The box core samples she has taken are all in ziploc bags. She let them dry for a few days to reduce the water content – although Liz has to be careful not to let them dry too much. The sediments are such a fine clay that if they dry out completely they will become brick-hard and extremely difficult to test.
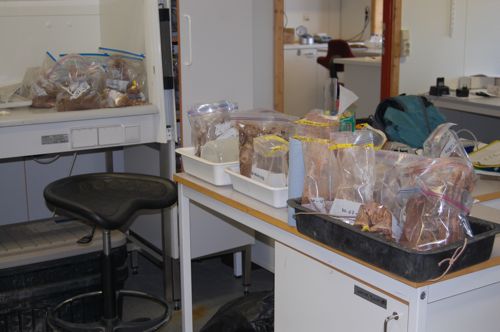
Her bagged samples will be shipped back to the States. In the fall, there are several techniques she'll use to find out what minerals are present. One of the main techniques Liz will be relying on is called x-ray Diffraction (XRD).
X-ray Diffraction is a pretty complicated technique that uses x-rays to probe the structure of minerals down to the atomic scale. You might wonder why we don't simply look under a microscope? Well, conventional microscopes use light, and it turns out that the wavelength or size of light waves is way too large to detect individual atoms or molecules. Remember that when you see an object your eyes detect light waves that have been reflected off the object. If the object is smaller than the light waves, there is no way for the waves to bounce off the object and get reflected into your eye. x-rays are extremely tiny compared to visible light – they are smaller than the size of an atom, so they can effectively be reflected off of atoms. Of course our eyes can't detect x-rays so we need a detector to collect the reflected x-rays.
When the x-rays bounce off atoms in a crystal (like a mineral grain in a sediment sample), through a process called diffraction, the pattern that the detector picks up gives information about the specific elements that are present and their structure. So it's a wonderful way to determine what the chemical makeup is and what the structure of the atoms is.
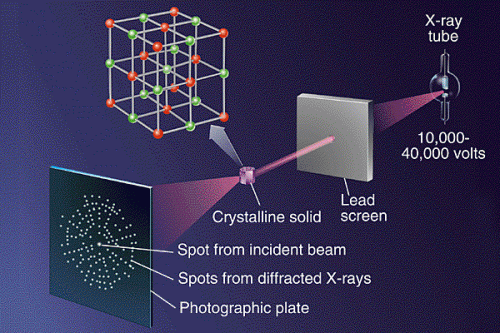
Image from http://nothingnerdy.wikispaces.com/X-RAYS
Liz will also use some much simpler techniques – for example she can use a sieve to sort out the different size grains in the mud. This is just like a cheap plastic sieve you might have used at the beach when you were a kid, but the holes are microscopic. Based on the proportion of grain sizes she finds, it might tell her about how the glacier is grinding up the rock in different places.
Once Liz gets the information about the minerals present in her samples, she'll look for patterns. For example, is she seeing a particular mineral in one area it would indicate that that particular area has a source of minerals that is coming from the same bedrock up under the glacier. On the other hand, if she is seeing a mixture of minerals in an area, it might indicate that there are several sources of sediment.
The box core data by itself will hopefully give Liz a very good picture of the source of sediments right now. Then, it will be really helpful to look backward and see what has happened over time – are the sources of sediment stable or have they changed over time? And what might that tell us about how climate is affecting the glacier?
Layers in the mud – How have the sediments been changing over time?
Daren and Rachel are interested in how the sediments have been changing over time, and what that might tell us about how the glacier is changing – and whether that can be correlated with climate change?
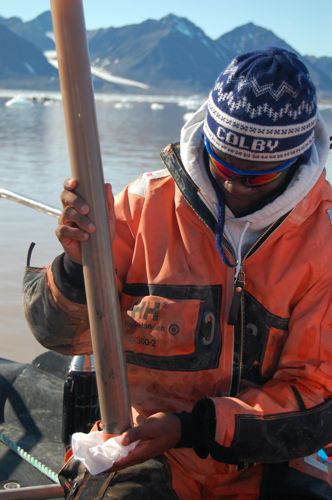
Now that Daren and Rachel have finished collecting their gravity core samples, they have been busy preparing their samples for shipment back to the United States. Unfortunately, most of the analysis will have to be done back in the States, as (a) we don't have the equipment here to do the analysis, and (b) it's pretty time consuming analysis.
Their preparation had several steps. First, they had to let the samples settle. At first, the samples looked like muddy water. But of course they were only interested in the mud, not the water. It took a few days for the mud to settle down. Then they siphoned out as much of the water as they could without disturbing the mud sediments. They then cut down the tubes and let them continue to sit. Finally, they capped them up tightly with a water-absorbing foam. This way they can be transported without mixing or otherwise disturbing the sediment layers in the core sample.

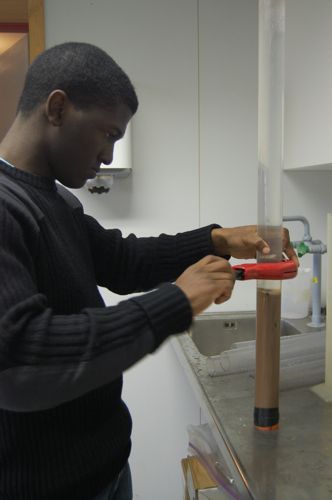
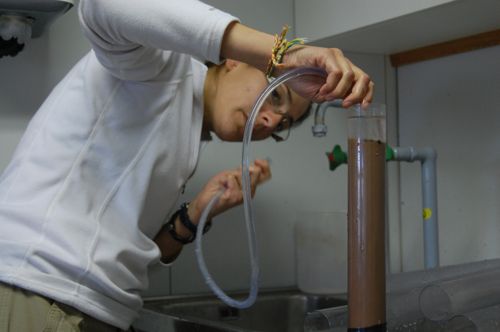
The first thing Daren and Rachel can do is to make visual observations – are there any clear layers present? Are there any indications of organic (living) material – these usually show up as blackish layers or blobs? Are there layers of sand? Are there air gaps? Could these be authentic gaps that were present in the layers, or were these introduced as part of the process of collecting the core?
The samples will be shipped back to UMASS, where they will be split in half using a very fine cutting tool. Then several observations can be made.
One set of observations will require the use of a machine called a Linescan imaging machine to take extremely high resolution photographs of the core – this will help put into relief some of the layering that might not be visible by the naked eye.

The cores will also be put into a very cool machine called an x-ray fluorescence (XRF) machine. This process is similar to x-ray diffraction in that the sample is bombarded with x-rays, but instead of detecting the way the x-rays are reflected, or bounced off the sample, it uses the fact that some of the x-rays are actually absorbed by the material. Fluorescence refers to the process by which a substance absorbs light from one energy and then re-emits light at a different energy (usually this is a lower energy). (A fluorescent light bulb uses this same process – mercury gas in the tube is energized through electricity, it emits ultraviolet light which is absorbed by the phosphor material on the side of the tube which then re-emits, or fluoresces visible light.)
In the x-ray fluorescence machine, when x-rays are absorbed, the material will then re-emit light, but at a lower energy than the x-rays themselves. Different atoms will emit different energies of light. Detectors will pick up the different light energies – knowing which type of light was re-emitted can tell how much of each element is present in that part of the core. By scanning over the whole core, you can get a measure of which elements were present at different times. Remember that the core is a record in time - the deeper you go into the core, the older those sediments are. So if you find a layer with a high concentration of one element in one part of the core, and then that concentration goes down, for example, that would indicate that there was a change of some sort in the way the sediments were being deposited.
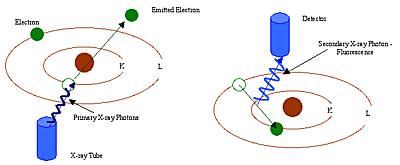
Image above from http://www.equipcoservices.com
The Big Picture
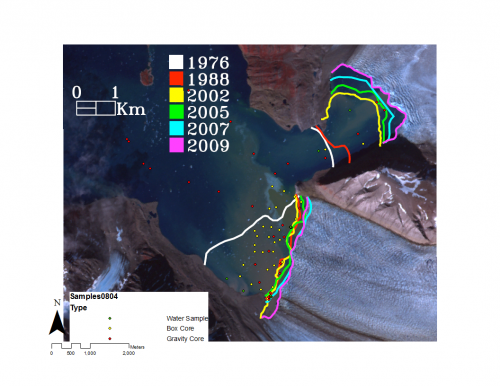
So what might we understand after looking at all this data? Getting back to the big picture, the analysis of chemicals at different layers can tell you something about how the glacier was behaving at different times. If you connect this with what was happening with climate, you might be able to make a connection between how the climate was affecting the glacier. For example, were there more living things in one area at a specific time? If so, why? Did that change at different times? Were there areas that were more turbid (mixing) because of subglacial stream, for example, and has that changed?
So putting it all together – the mud samples from the surface and deeper layers, the team will look for two types of patterns – patterns in space and patterns in time. By space I mean the team will look at the fjord as it exists today and see how sediments are being deposited in different places. By time I mean the team will look at how sediment deposition patterns have changed over the past several decades.
Some of the samples we've taken are in areas we know the glacier was covering within the past 50 to 100 years. So the sediment samples can reveal quite a bit about what has happened over this short time period.

Personally, I am quite eager to see what the results show and what we learn about the behavior of this particular glacier system, and glaciers in general. I'm also excited to take a trip to UMASS when the cores are split open and put into the various scanning machines. Who knows, maybe I'll be able to take some students with me!


Comments