Today we stuck around Ny Ålesund instead of going out in the field. We had a long group meeting to determine where everyone was with their data collection. We're going to be wrapping things up before too long! By the time we were going to go out on the fjord, we realized that the fog was quite thick so we decided to stay close to home. I take this opportunity to write more about the basic science behind what we're doing here.
What does oceanographic data tell us about how glaciers are behaving?
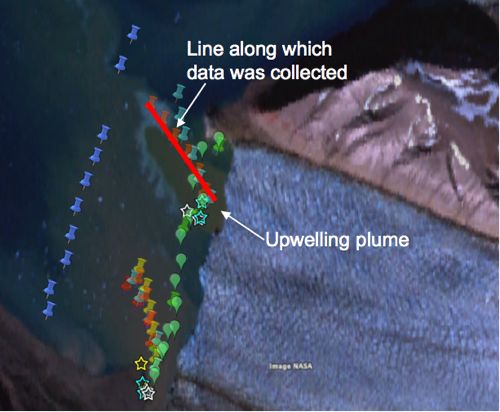
At the front of the Kronebreen and Kongsbreen glaciers water is pouring into the fjord. The glaciers also dump water from two places – an upwelling plume (a place where water comes out from under the glacier and then pours up along the face of the glacier and into the fjord) and a stream that ends at a delta. The source of both of these is water is sub-glacial streams (streams under the glacier).
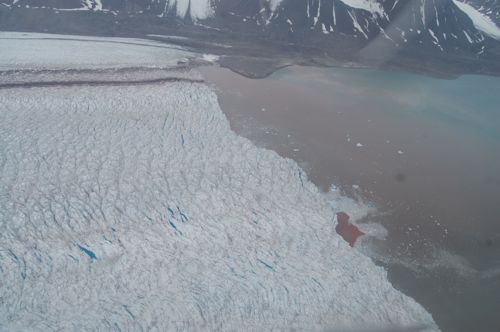
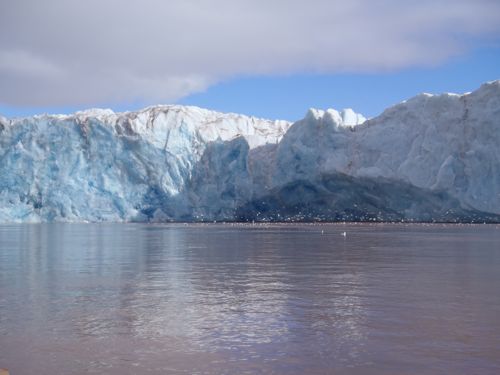

In order to understand the data we collect to investigate how this system of glacier-water-ocean behaves, I need to back up and review some basic science concepts related to properties of water: Density, Temperature, Salinity and Turbidity
Density
Density measures how tightly packed the molecules are in a substance. It's determined by dividing the mass of a substance by its volume. Another way to think about density is "how much stuff there is" compared to "how much space it takes up". Common units for density are g/cm3 (grams per cubic centimeter).
You probably already know that what determines whether an object can float is how the density of the object compares with the substance it is immersed in. For example, the density of water is around 1 g/cm3. (Picture a tiny cube shaped container of water 1 cm on a side – the mass of this amount of water is 1 gram.) If an object's density is less than 1 g/cm3, then that object will float. If its density is greater than 1 g/cm3 then the object will sink.
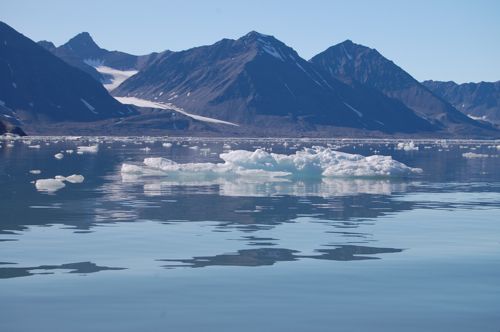
As common as water is on our planet, water is a very unique substance. Its density properties are very unusual in that its solid form (ice) is less dense than its liquid form. This is why ice floats. The density of ice is around 0.917 g/cm3. This is also why sea ice always forms on the top of the ocean and liquid water remains below – this has important implications for living things; ice can really protect anything living in the water below because it provides an insulating layer.
Effects of Temperature on Density
What does "temperature" really mean? We all know that temperature measure how "hot" or "cold" something is, but what are we really measuring when we take the temperature of something?
The technical definition of temperature is the "average kinetic energy of the particles in a substance". In easy terms, temperature measures how fast the individual molecules in a substance are moving. Turns out that the tiny bits of matter we call molecules are always moving – even when an object is frozen solid, the molecules jiggle around a bit. The warmer an object is, the faster its molecules move. So a thermometer measures that motion and we assign a "degree" value to that measurement.
We know that ice has a lower density than liquid water. But the density of liquid water itself is not constant – it depends on temperature. Interestingly enough, water is its greatest density at 3.98ºC (39.2ºF). That's when its density is 1 g/cm3. As the water gets either warmer or colder than that, its density goes down.
Temperature measurements are quite important when studying the interactions between ocean water and glaciers. Ice always melts at 0ºC, so when meltwater comes into the ocean from a glacier, it is colder than the ocean water it comes into. The effects of temperature are pretty small, actually, compared with salinity, but knowing the temperature can tell us something about where the water came from.
Salinity
Salinity is a measure of how much salt is dissolved in water. Salinity is a very important thing to monitor at the glacier margin, as the water coming from a glacier is freshwater and the water in the ocean is saltwater.
When salt is added to water, the density goes up. This is because the sodium and chlorine in the salt (salt is sodium chloride) separate from each other and get pulled closely towards the water molecules. Although this isn't really what is happening, you can think of these atoms as sort of "filling in the gaps" between the water molecules. Therefore, you aren't increasing the volume of the water very much, but you're adding more matter – this increases the mass without taking up much more space. Thus, the density becomes greater as you add more salt to the water.
Water in the ocean has an average salinity of 3.5%. But near areas where there is input of freshwater, say near a river delta or, in our case, near glacier melting, the salinity will go down.
So what happens when fresh water meets salt water? If they are at the same temperature, then the fresh water would rise to the top, as its density is less than that of the salt water. But what if they are at different temperatures? Then the picture gets more complicated.
But it gets more complicated still, as there is one more factor to consider – sediments suspended in the water...
Sediment Concentration
As a stream carries mud into the ocean, it can carry with it a great deal of sediment. What happens to all this sediment that is carried along, when it reaches the ocean? Does it get dumped immediately into the ocean, or is it carried further along into the ocean? Well, it depends upon several factors, including the size of the particles, but also how the water is moving.
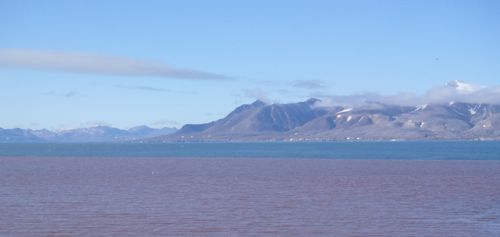
Imagine you're studying an area of water many meters deep and hundreds of meters across. How would you know where the sediment is going?
A very common measurement to measure the amount of sediments in the water is called turbidity. Turbidity measures how clear or cloudy the water is. By measuring the turbidity at different places we can try to track where the sediments are going.
Water Currents
A final thing to consider is the water current – how fast the water is moving at any particular location. There are several ways to measure water current. You can simply drop a floating object in the water and see how fast it moves (which is sort of how we are doing it here), or you can use a more expensive, sophisticated device that uses sound waves and the Doppler effect to see how sound reflects off tiny bits of matter in the water – similar to the echo sounder but much more sophisticated. This type of device, called an Acoustic Doppler Current Profiler, is pretty cool (see some images from the Nathaniel B. Palmer - a research vessel I was on in 2007 – that shows the kind of data you can get from this type of device.
Ross came across an incredibly low-tech device that seems to be working quite well – called a "drogue". (More down below)
How can we use oceanographic data to understand what the glaciers are doing?
We hope to understand quite a bit about glacier behavior by looking at the oceanographic data. We do this primarily by using a "CTDA research tool that is submerged in the water to measure conductivity (salinity), temperature, and depth. device". CTDA research tool that is submerged in the water to measure conductivity (salinity), temperature, and depth. stands for Conductivity, Temperature, Depth. We also add a Turbidity sensor so the device measures 4 different properties of the water.
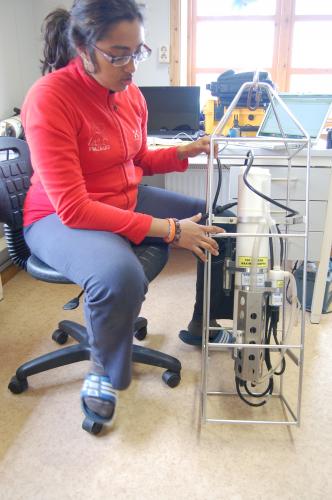
The way this instrument works is as follows: The four different instruments (Conductivity, Temperature, Depth and Turbidity) each sample data at the same time. Daksha has it set to sample data every half a second. We lower the device into the water (trying as hard as possible to keep the boat in one position, which can be a challenge in strong wind or a strong water current!), and the device makes its measurements. Once we get back to the lab, Daksha uploads the data into her computer and uses software to interpret the data and to make graphs of the data.
The salinity of the water can be determined by finding how well electricity flows through it. It turns out that the electrical conductivity is greater in saltier water than in less salty water. There is a sensor that determines the salinity of the water by sampling the water and passing an electric current through the water. If the current passes through easily, then it is saltier. Software is then used to calculate the salinity once we know the conductivity.
The temperature of the water is measured by a simple "thermocouple" thermometer – this is a commonly used type of device that determines the temperature by looking at how the electric voltage changes between two different metals whose electrical properties change with temperature.
The depth is determined by a type of pressure sensor called a piezoelectric sensor – this is a device whose electrical properties change with pressure. Basically, as the material is stressed, or when a force is applied to the material, it develops what is called an electric charge – this can be detected easily, and then calibrated with the amount of force applied. The deeper in the water you are, the greater the pressure that the water applies to the sensor. So the device measures pressure, and then we use software to convert this to depth. (If you've been reading my journals, you may recall a discussion about the HOBO devices, which measure depth in basically the same way.)
Finally, we use the CTDA research tool that is submerged in the water to measure conductivity (salinity), temperature, and depth. device to determine the sediment concentration, which we do by measuring the turbidity of the water. This is done by a process called optical backscattering. Essentially what is done is that a laser light is sent into the water, and a sensor detects how much light is reflected back – any reflected light would be reflected off any tiny particles in the water. The laser light is in the infrared part of the spectrum (850nm wavelength, for those who know a bit about these things), which is a type of light that transmits easily through water.
Measuring ocean current
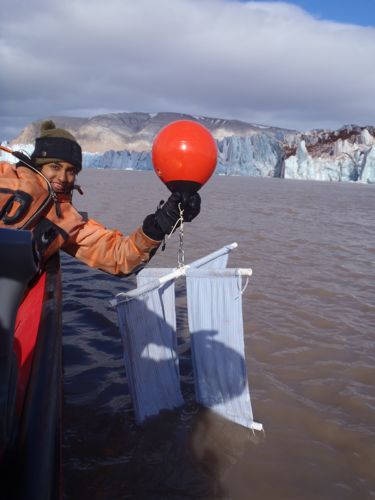
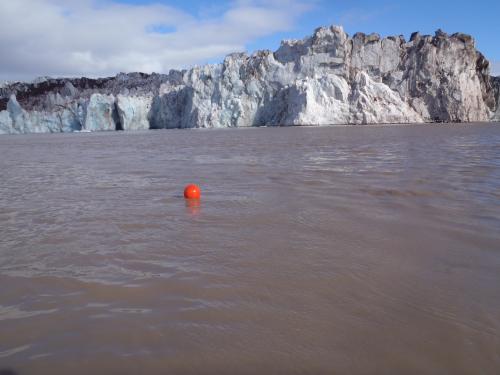
Ross came across an ingenious idea for finding the speed and direction of ocean currents at different depths – creating a simple device called a drogue. The drogue Julie and Ross built is quite simple – four pieces of cloth attached together with PVC pipes. As it moves along, even if it spins one side of the device is always being pushed. The device is kept afloat with a buoy and weighed down with a rock. We can adjust the line between the drogue and the buoy to find the current at different depths. (In building the device, Julie got to practice her sewing skills at the sewing machine here in Ny Ålesund!)
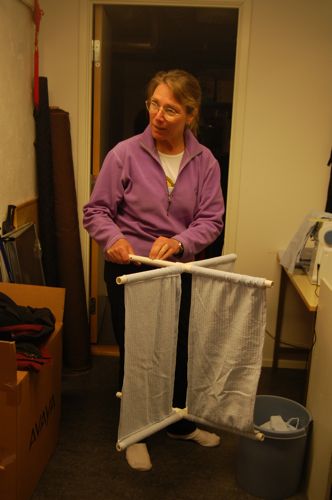
Essentially we drop the drogue off at a point, and then wait several minutes and them pick it up again. The drogue will move with the water as it flows along, and if you know where and when you dropped it off (using a GPSA Global Positioning System (GPS) is a satellite-based navigation system used to track the location or position of objects on the Earth’s surface. device) you can easily calculate the speed and direction that it traveled.
(It's interesting to me that all of these sensors use the electrical and optical properties of materials! Interesting how physics and geology come together here, once again!)
What do we do with this data?
Using the CTDA research tool that is submerged in the water to measure conductivity (salinity), temperature, and depth. data, Daksha will be able to create some really interesting charts. These charts will give us a picture of the different layers in the ocean. The layering of water in the fjord is called stratification. Then she'll need to try to explain why the fjord is stratified the way it is, and how this might be changing over time (by looking at similar data from past years).
Daksha is still in the data collection stage, so over the next week she'll finish collecting all her data, and then over the next several months she'll be able to get a good picture of what's happening in the fjord.
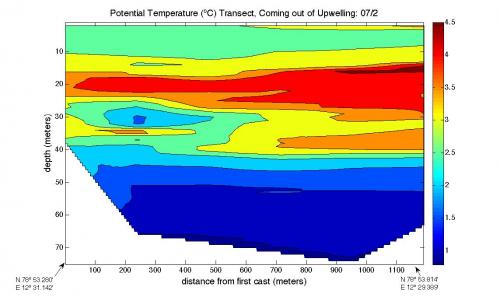
But I thought I'd share with you some preliminary graphs she's made. These graphs were taken from several points along a line in the "upwelling plume". She started from a position a couple hundred meters from the ice face (unfortunately it's quite dangerous to get too close to the ice, because that data would be really interesting to have).
The first graph, of temperature, shows that the coldest water is at the bottom, which makes sense. Then it gets warmer as you go up but then it gets colder again as you get close to the top. This could certainly be from fresh water coming out from under the glacier, going up to the top of the water and then flowing outward.
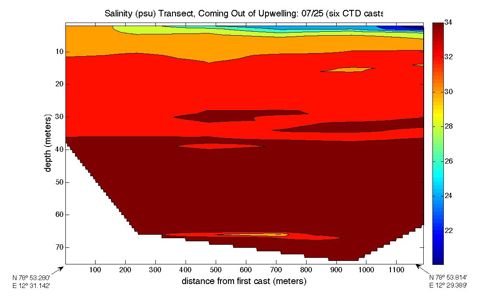
This is confirmed by the salinity data in the second graph. In this graph, the salinity goes down as you get closer to the top. Again, this makes sense – the less salty water would rise up to the top. The reason that it's not completely fresh water is that it probably mixed a bit with salt water after it came out from under the glacier.
Finally, Daksha's turbidity graph shows stratification as well, and this makes sense after looking at the other two graphs – the most turbid water is the water that has the most sediments suspended in them. Since this water is less dense, it rises to the surface – you can see that the most turbid water is at the top.
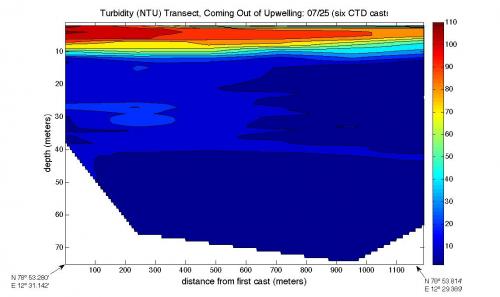
The team had an exciting moment yesterday when Daksha tested out two drogues at two different depths. She put one in at 20 meter depth, and another at a depth of 50 meters. What was totally unexpected was that the one at 20 meters moved very quickly towards the glacier! The one at 50 meters was stagnant (it did not move). If you combine that information with the other graphs, one possible explanation is that this middle layer is warmer water coming in from further out in the fjord. The fact that it is warmer there and has less sediment supports this idea.

More information will come out as Daksha continues to collect data and analyze it. But for now, it's interesting to see the different layers that exist in the water and to realize that the water can be interpreted to determine where it came from – and then, hopefully, to connect this with how the glacier is behaving.


Comments