More Setbacks...
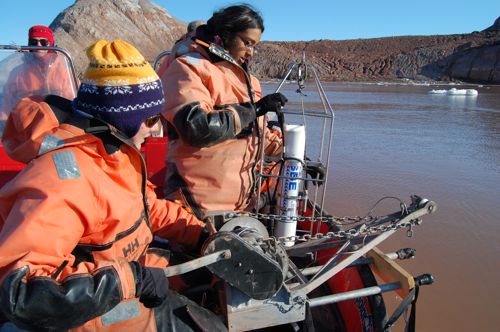
Yesterday we had a number of setbacks (again!). We started out ready to take lots of data, and soon after we began doing CTDA research tool that is submerged in the water to measure conductivity (salinity), temperature, and depth. casts in earnest, we discovered that our infamous winch mechanism was at it again! This time the wheel over which the cable runs had become completely worn through by the friction of the cable. So that pretty much ended it for doing CTDA research tool that is submerged in the water to measure conductivity (salinity), temperature, and depth.'s.
So then it was on to uploading HOBO data... until we discovered that, once again, a HOBO device had been ripped off its tie-off spot. There wasn't much we could do after that, except head home and put our heads together about how to solve these problems.
Hunting For HOBOs
As for the lost HOBOs, well, we figured it was worth it to go fishing today for the equipment... we knew that it was possible that both lost HOBO units were lying on the sea floor in relatively shallow water near the rock where they were lost. I figured it was also worth a try to send my waterproof camera down to the bottom to have a look around.
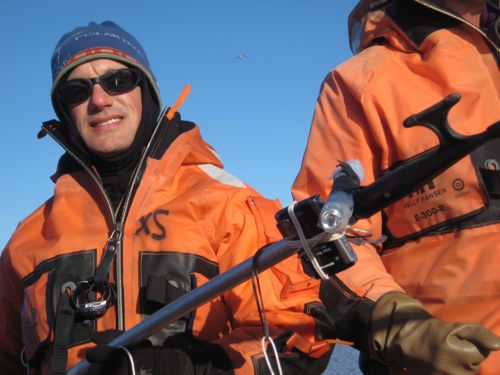
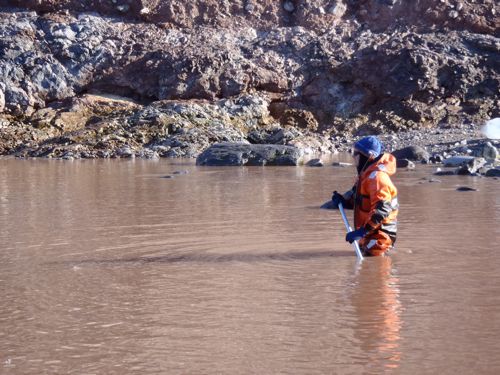
We had to get up really early today so we could fish around at low tide, when it would be shallow enough to wade around near the rock. That meant getting up at 5:30 so we could beat the 7:00 low tide.
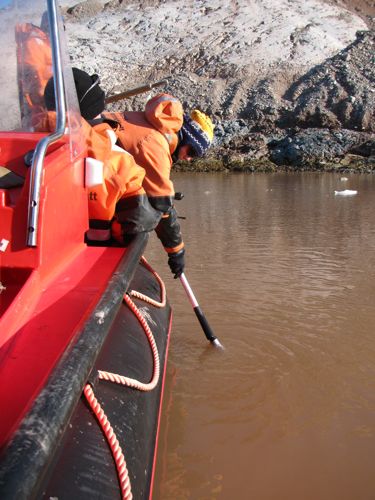
Unfortunately over an hour of searching we turned up nothing. As excited as I was about using my camera, the water was so completely brown with suspended sediment, that it was impossible to see anything. We fished around with the boat hooks for a while, but turned up nothing. So we're down to one HOBO unit – we're pretty confident that this one is in a safe location, but with only one unit it limits the kind of data we can collect.
Iceberg Surfing
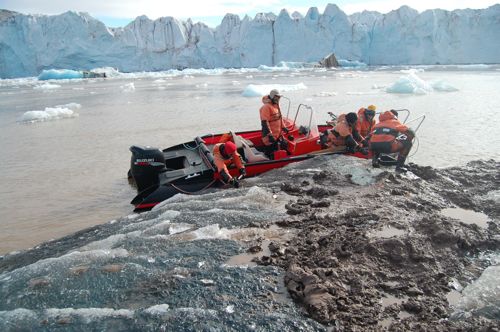
We spent the rest of the morning collecting a great set of CTDA research tool that is submerged in the water to measure conductivity (salinity), temperature, and depth. data. We witnessed some spectacular calving events, and spent some time gathering some sediment from icebergs. In fact, we had a chance to get off and stand on an iceberg!!


And That's a Wrap!
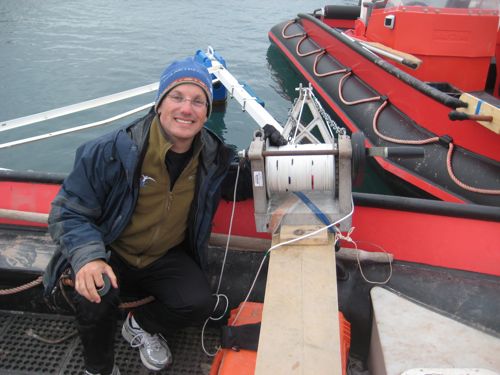
As for the winch, we got some assistance from Vojtek and Steiner (the go-to fix-it guys from Norse Polar) who helped us cut off the old wheel and fashion something temporary. Then we took off the cable and decided to use strong nylon line instead.
How Glaciers Form and Flow
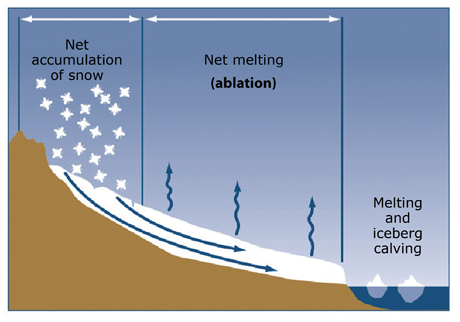
Let's back up and review what glaciers are and how they form. If the climate is cold enough, snow that falls in an area may stay frozen all year. Year after year, as more snow accumulates, the weight of the snow compacts down into denser sheets of ice. Gravity will pull this ice downhill, which causes the glaciers to literally flow. They flow slowly, but fast enough that with time-lapse photography, the motion of a glacier can be observed:
http://vimeo.com/5414579

There are many different types of glaciers in the world. Here in Svalbard most of the glaciers are called valley glaciers – these flow down from ice sheets in the high mountain areas. The rate at which glaciers flow can vary enormously. The main factors that influence how fast glaciers flow are the underlying topography and the amount of melting that is occurring at the edges and top of the glacier. This melting can act to lubricate the glacier. In fact, one of the concerns about rising temperatures is that glaciers will begin to flow faster as a result of increased melting.
Here are some examples of ice flow rates on certain glaciers for comparison:
Kronebreen glacier (the one we are studying) flows approximately 0.5 meters per day
Columbia glacier in Alaska flows approximately 2-3 meters per day
Ice streams in Antarctica flow approximately 3-4 meters per day
Jakobshavn glacier in Greenland flows approximately 10 meters per day
By the way, it's important to note that the "retreat" of glaciers isn't a backward movement – it just means that the ice at the most downhill part of the glacier is melting faster than the snow up at the top can replace it. Glacial geologists call the balance between the amount of snow being added to the glacier and the amount that the edge of the glacier melts the mass balance of the glacier. In most glaciers, there is a negative mass balance, which means that they are melting faster than the snow is adding to them.
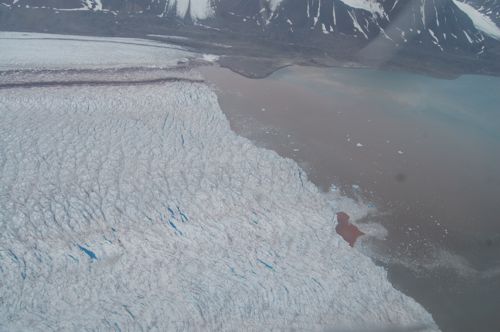
But again, it's important to remember that the glacier is still flowing downhill, even if it is receding. A dramatic illustration of this is the Kronebreen glacier that we've been studying for the past week. The amount of ice that is calving off the front of this glacier is simply amazing – every day it seems like we witness several pretty good sized calving events. The glacier is constantly moving, and the ends of it are constantly falling off into the sea.

http://
If a glacier begins to flow faster than it was in the past, but there isn't an accompanying increase in snowfall, then the total amount of ice in the glacier will be reduced. Glaciologists would say that the mass balance has decreased. An additional problem is that as a glacier flows faster, it stretches and thins. (Sort of like pulling on a piece of taffy.) This stretching and thinning can cause additional cracks (called crevasses) to form. This, in turn, will also increase the melting rate of the glacier.
What I just described above is called a positive feedback loop. A positive feedback loop is a system where any change to the system makes the system more and more unstable. (An example is population – if more people have more children, then the population will continue to grow and grow.)
GlacierA mass of ice that persists for many years and notably deforms and flows under the influence of gravity. melting as a result of warming temperatures is such an example, because as glaciers melt at a faster rate, the fact that they are melting increases the rate of melting.

Dirty Ice
Remember that glaciers are flowing. Glaciers remove an enormous amount of rock as they flow across the landscape. I think that's hard to imagine, but once you stand next to a glacier it makes perfect sense. These glaciers are hundreds of feet thick, many hundreds of feet across, and miles long. The sheer weight of that moving against the ground, combined with freezing and thawing that occurs at the base of the glacier, would do a huge amount of damage to the rock below – breaking and pulverizing the rocks. The glaciers carry and push all this debris downstream until the ice carrying this debris melts. This either happens on land or, if the glacier comes right down to the ocean, at sea. If it happens on land then a moraine is created.

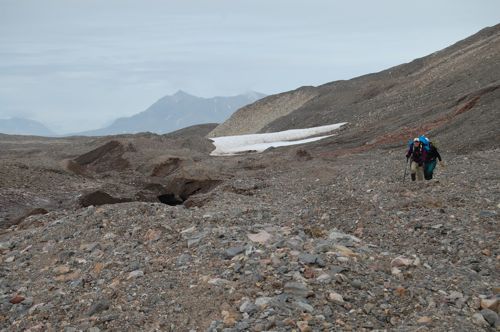
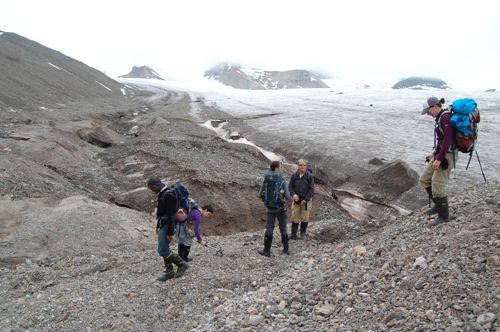
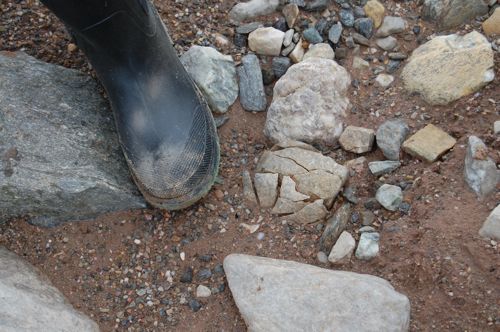
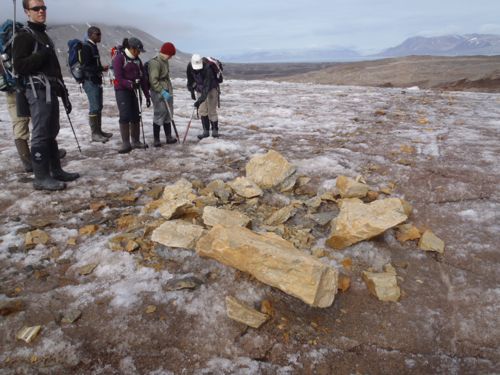
Here in Svalbard we've seen some nice examples of what happens to rocks when water freezes inside them. In many cases the rock will actually shatter - this is called frost shattering. It's clear when you see this that rocks can really split simply by water seeping in and freezing. You can then imagine what must happen on a larger scale. If you have an area blanketed by many many square miles of ice, then at the bottom of that ice any melting and freezing will just break the rocks apart.
This melting and freezing happens at the bottom of a glacier, which leaves the area "carved" out in a typical U-shaped valley.
Interpreting the Story of a GlacierA mass of ice that persists for many years and notably deforms and flows under the influence of gravity.
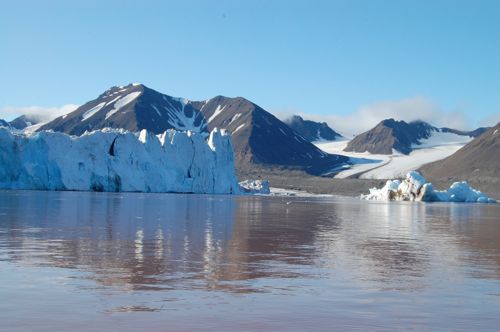
By studying the features and patterns of these moraines you can infer where the glacier was and what was happening to it – for example: was it flowing quickly, or was it stagnant, and what direction was it moving?
If the glacier ends at the ocean then the observations are more difficult. But by studying both the sediments on the seafloor, and by making measurements of the water in front of the glacier, we can make inferences about how the glacier has been behaving.
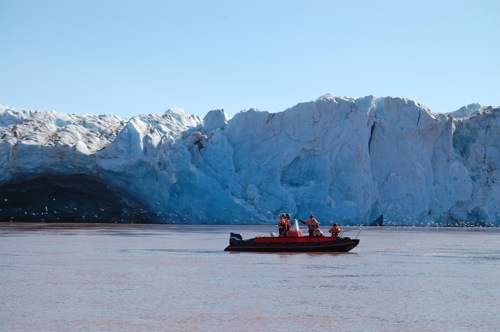
So that's the goal of the research we're doing here.
One important set of observations we are making here in Svalbard around the properties of glacier movement is the rate of glacier calving. We are interested in knowing whether the rate of calving is changing over time. This could be an indication that the glacier is flowing faster.
A useful tool for monitoring calving events is the HOBO water level sensor. This is left close to the ice under water. The sensor is actually using pressure to monitor water level – if the water level goes up, then the pressure at the bottom of the ocean goes up. So by monitoring the pressure changes in this way, we can determine the height of the water. We can then get a record of the calving events. Rebecca will be looking at calving rates over the period of a few weeks and comparing that with meteorological data to see if there are any correlations.
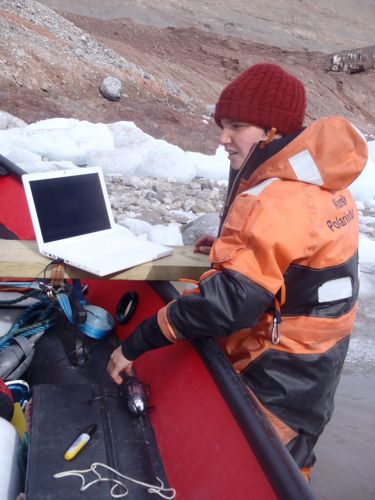
For much more on the HOBOs and how they are used, check out my journal entry from July 22
Also the REU team is looking at the sediment data and bathymetry (sea floor mapping). By looking at specific features in the sediment core, they will be able to determine how the glacier is melting and flowing. Remember that a glacier is carrying loads of sediment – when icebergs calve off the glacier and when ice melts, any sediment it is carrying will be deposited on the sea floor.
Our team has been taking sediment cores. These are columns of sediment (usually around 40cm long) that will tell us the story of how the glacier has been depositing sediment over time. By looking at patterns and changes in that sediment record, the team will be able to make inferences about how the glacier is flowing – is it flowing more rapidly (and thus, dumping more sediment)? If it is, what are the possible specific causes?
Taking a sediment core is a physically difficult process. For much more on the sediment coring process, check out my journal entry from July 26
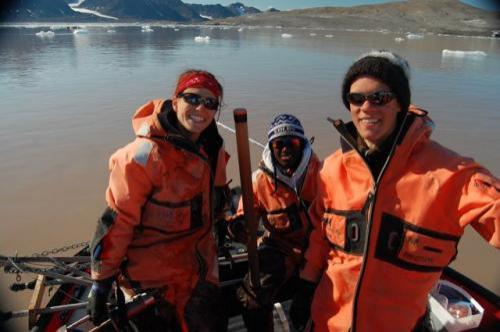
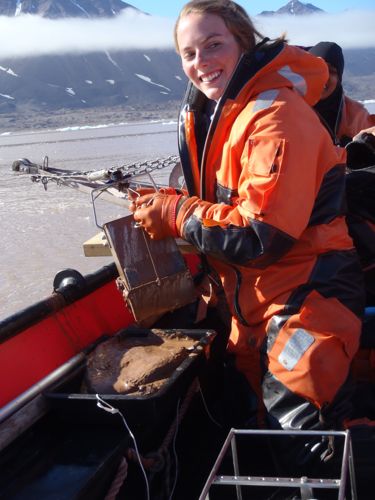
We are also taking box cores. These are samples of the surface mud on the sea floor. By studying the minerals in the mud, we might be able to infer where the rock was that those sediments came from. Perhaps by looking at previous data we can also see changes in the sediment composition, which will also give us information about how the behavior of the glacier has changed.
Taking a box core involves lowering a metal box down to the sea floor. The box is open, but attached to the box are spring-loaded doors. We lower the box down until a few meters above the sea floor, and then let it drop fast into the mud. Then we send a "messenger" (a small piece of metal) along the cable which trip the springs and the doors close. If all goes well, we get a small bit of the mud on the sea floor. For more detailed description of the box-coring process, check out my journal from July 25
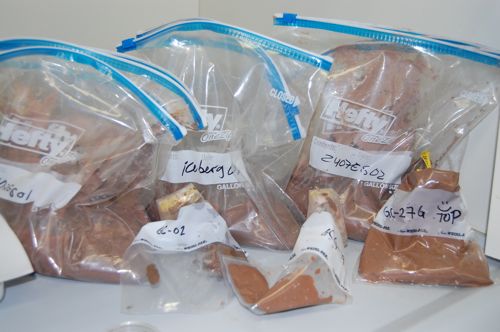
We can't really analyze the sediment data here in Ny Ålesund. We'll have to take the samples back to the States for analysis using some sophisticated tools to determine which minerals are present in the samples. Shipping the sediment cores are tricky as we want to preserve the structure of the layers. So what we're doing now is letting them settle down, and then siphoning out the water on the top of the core. Then we cut down the plastic to just the same size as the core, pack it tightly with foam, and then get them shipped back. For the box cores, the sediment can be shipped back as is (because there's no layers to worry about). In fact, they are sitting here in Ziploc bags waiting to be shipped!



Comments