Here is a chart of chick growth as of July 28. Slashes indicate data points that were not able to be collected, due to chicks too far back in the nesting crevice to be taken out. (Some of these were able to be removed by Rachael’s slender arms). July 26 was an extremely cold, stormy evening on the slope. When a risk of hypothermia became a possibility, the data collection was postponed.
Chick Growth - Kap Höegh, Greenland 2007
Chick mass measured in grams.
Date Nest #50Nest #55 Nest #58 Nest #613 Nest 767 Nest #33 Nest #6 Nest #728 Hatch Date (mass unk) 16 July 16 July 16 July 13 July 14 July 13 July 16 July 16 July 22 July 33.7 56.049 86.769.7 59.6 // 24 July 46.2 72.4 59.6 89.5 91.8 77.5 69.4 53.3 26 July 53.4 91.6 84.1 / / / 92.4 70.3 28 July 66.6103.4 93.9105.0 104.595.1 103.486.1
Questions:
Given that chicks reach an average of 128 grams at peak mass (based on previous studies), which occurs at approximately day 19, how many grams per day should chicks gain?
Are the chicks measured here on track to reach average peak mass?
Graph the data collected for nests number 50, 55 and 58. Create a line of best fit.
Now graph the data for the rest of the nests. Does the growth seem similar to those with complete numerical information?

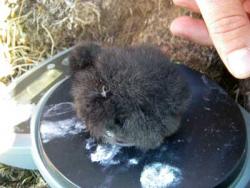
A chick being weighed on an electronic gram scale.
A chick being weighed on an electric gram scale.


Comments