Gravity Cores by Dr Lee Cooper
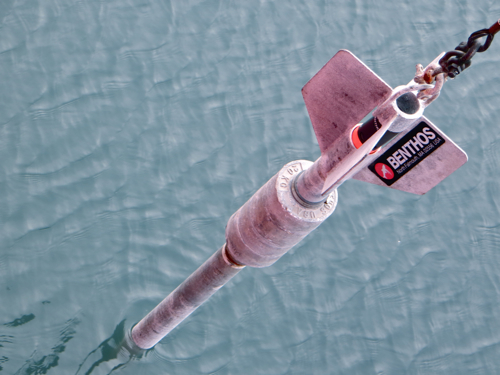
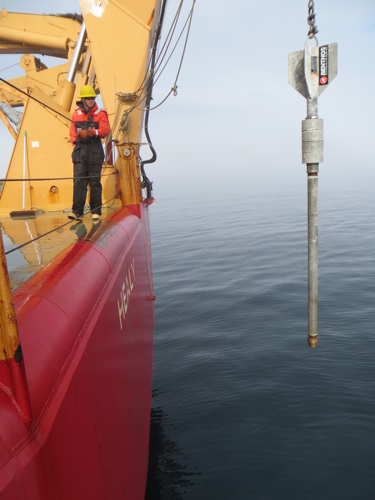
The gravity core is an instrument shaped like a missile. It is designed to forcibly enter a meter or more into the sediments. We are primarily using it to collect long, small diameter cores that are suitable for measuring sedimentation rates.
SedimentationThe process by which particles suspended in water settle to the bottom of ground surfaces. rates are the rate at which sediments are deposited to the sea floor. We use units like millimeters (of sediment) per year. So how does this work? Radioactive isotopes that are in the sediments can provide clues. For example lead-210 is a natural radioactive isotope that is deposited in sediments. It is a “daughter” product of decay of the radioactive gas, radon-222. So when an atom of radon-222 decays in the atmosphere, it quickly becomes an atom of lead-210, which is quickly washed out of the atmosphere, since lead is particle-reactive and sticks to rain and dust. Once back in the ocean, the lead-210 atom will sink to the seafloor and its half-life in the sediments is 22 years. Half-life for lead-210 means that in 22 years, only half of the lead atoms that was there in the beginning will still be there. In another 22 years, another one-half of the lead will have decayed away, so only ¼ of the original amount will be left. And so forth, until eventually all of the atoms will have decayed.
If the sediments fall to the seafloor in an even and consistent matter, the amount of lead-210 will decline as you go down the core in depth, and the rate of sedimentation can be estimated. It actually is a little more complicated than this, because there is natural lead-210 already in the sediments (in addition to that which falls out of the atmosphere), but it can be accounted for.
Another isotope we measure is cesium-137, which is not natural, but was created during the nuclear bomb testing era in the 1950’s and the 1960’s, primarily by the United States and the Soviet Union as they tested nuclear weapons that distributed radioisotopes over much of the earth’s surface. The dangerous effects of spreading radionuclides over the earth’s surface was recognized, so a treaty was signed to stop this testing, at least in the atmosphere, ocean, and in space. However, immediately before the Atmospheric Test Ban Treaty was signed and when into effect in 1964, a large number of tests were conducted, so the cesium-137 peak in a core was typically deposited in ~1963-1964. Thus in a core, if this peak is deposited at a depth of 10 cm, and nearly 50 years have passed since the mid-1960’s we would estimate a deposition rate of 0.2 cm (or 20 mm) a year. This is also a little more complicated than it sounds because animals in the mud tend to mix up the sediments, so sharp cesium-137 peaks are not always measured.
Why are sedimentation rate data useful? For our work in the Chukchi Sea, if oil development occurs as expected, a certain amount of pollution is likely to result. Knowing the sedimentation rate is helpful for estimating how long small or even large amounts of pollutants might remain in the system and available to the food web until they are permanently buried.
From the Florida Team
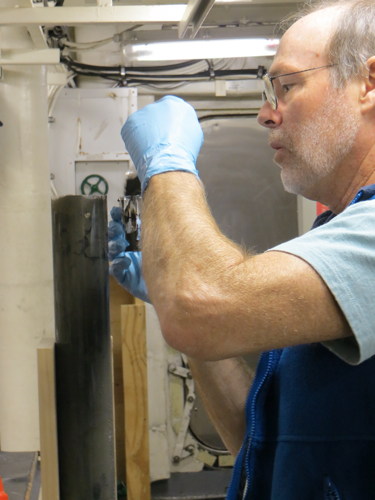
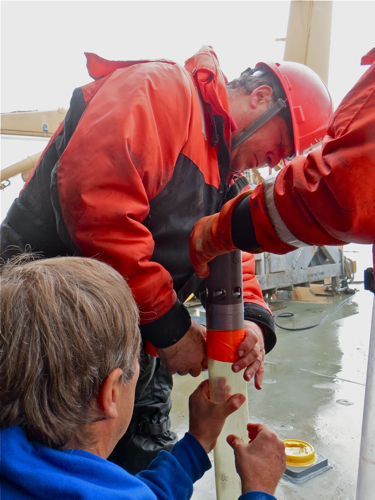
Scientists from Florida Institute of Technology are also collecting sediment cores to obtain an historic record of the deposition of potentially toxic metals, including mercury and lead, at the bottom of the Chukchi Sea. Older sediments are found in the deeper layers of the sediment. Bob Trocine and John Trefry are cutting the sediment core they collected into layers in the video clip. The bottom of the 3-foot core probably dates back more than 400 years. The scientists have found that the sediments in the Chukchi Sea are free of mercury and lead pollution right to the present day. They also have obtained a valuable baseline for natural concentrations of mercury and lead in the sediments so that they can easily identify any future changes due to human activities.
Click Graph of lead in the Chukchi Sediments to view a graph of the lead in the Chukchi Sea sediments.
http://youtu.be/Iy--NDPStyc
Final Note
We still have a lot of work to do as we wind up the expedition. Special thanks to Lee Cooper and John Trefry for the contributions.
Here is a poem that captures last night's activity of washing mud off of 19 Van Veen grabs.
Mud Game
Hose
Box seine
SLOW...zap
Play again?
2-players
Hoses
Box seine
mussel threads
SLOWER...zap
Play again?
3-players
Hoses
Box seine
Clay
SLOWEST...zap
Play again?
| Attachment | Size |
|---|---|
| Graph of lead in the Chukchi Sediments0 bytes | 0 bytes |


Comments