First news
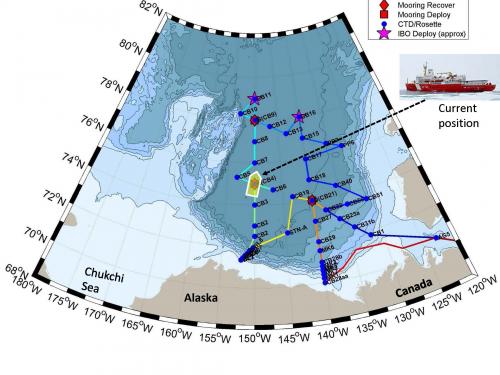
MooringAn anchor or weight attached to the sea floor used to hold a scientific instrument in place. A was successfully redeployed today and now (5:06 pm of local time) we are moving toward mooring D with a lot of CTDA research tool that is submerged in the water to measure conductivity (salinity), temperature, and depth. stations.
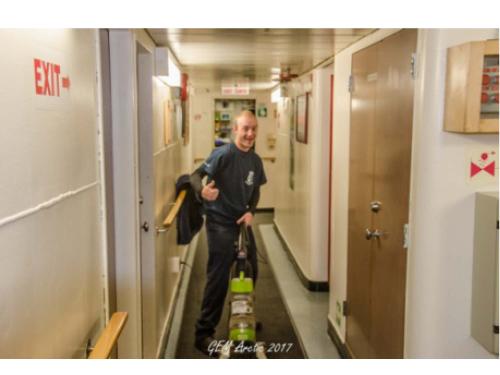
Life on the Louis
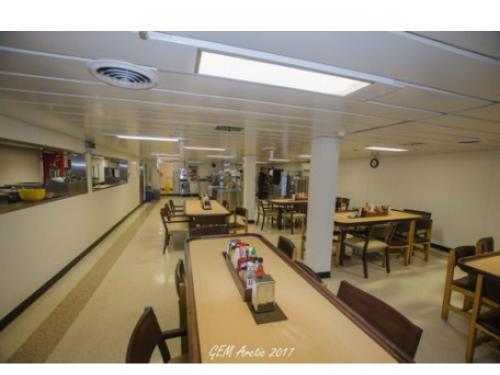
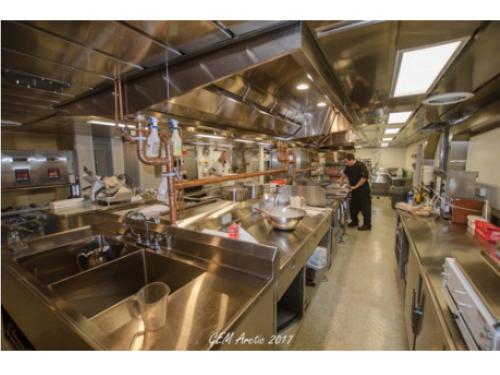
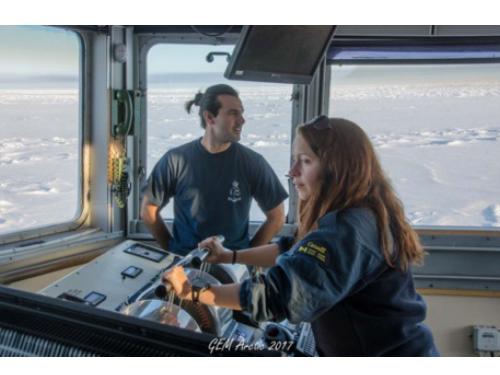
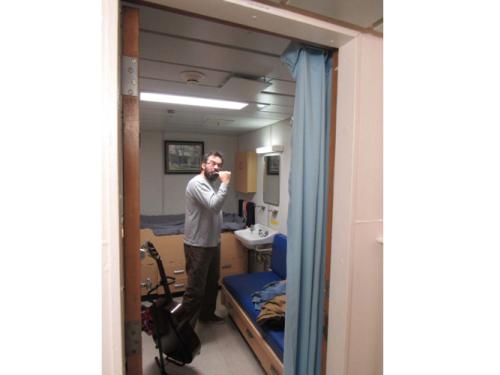
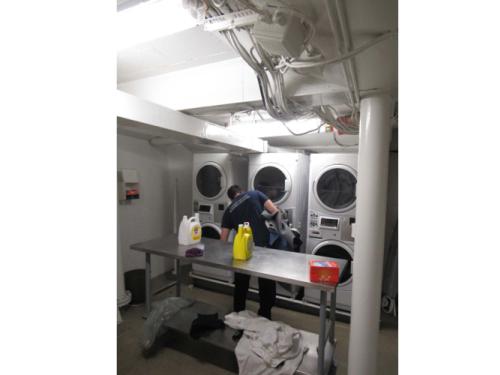
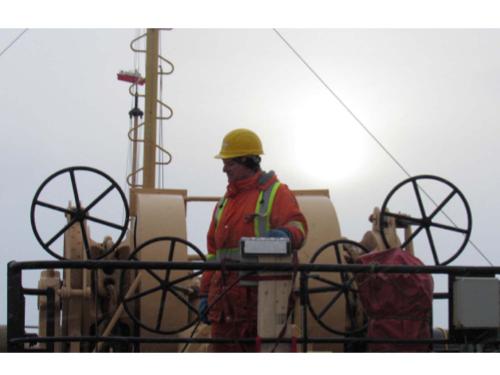
It occurred to me that life on the Louis is something that should be visited. There is a certain rhythm of the day to day going ons that somehow fills in between sample analysis, data processing, being "on station" either doing CTDA research tool that is submerged in the water to measure conductivity (salinity), temperature, and depth. rosette casts, Bongo net casts, or mooring recovery and deployment operations. Most on the science crew have established a wakeup time and a hit-the-hay time but it varies depending on which watch (day or night) they are on. I start my days at 6:30 am ship time which changes depending on which time zone we are in. I pull on some work out clothes and make my way to the gym and either ride the spin bike, get on the rowing machine, or lift some weights for half an hour. Most mornings there are a couple of like-minded individuals in the gym as well. Then it's shower time and off to the crew mess hall for some breakfast. By 8:30 I am headed up to the bridge level to do my daily check-in on the ship’s weather station and record the day's temperature (in ˚C), wind speed (in knots), percent humidity, and ship’s location. Then I take a stroll outside to check out cloud cover and what sort of precipitation is happening. My next stop is to the laptop where I start to write the day’s journal. I spend some time looking at photos or downloading photos from the previous day. Some days its 20-30 photos, other days it is hundreds that I run through looking for the real gems.
The daily science meeting starts at 11 am where the pertinent day's news is disseminated and occasionally a science presentation about the relevant research is given. Dinner is 11:30-12:30 then more journal work or photo taking or whatever comes up. By 3 pm or so I am feeling a little drowsy so I take a "coffee nap" which involves first drinking a cup of coffee then taking a 20 minute power nap. I read some research once that said it is more effective than nap first and coffee second – has something to do with the brain clearing out dopamine during the nap opening the receptors for the caffeine to stick to. More work till 5, then a break for Supper. So dinner and supper are the two mid-day meals, I have not had lunch in weeks.
The after-supper time is for wrapping up the day's dispatch and getting it to Andrey Proshutinsky so he can get it uploaded on the Iridium connection. Evenings are most often spent checking emails, conjuring up something new for a journal, socializing, reading, watching some TV or a movie and heading for bed around 10. Then morning... and it starts all over. Everyone (all 80+ of us) has his or her own variation on the theme.
Beaufort GyreA spiral oceanic surface current driven by the wind. Observing system: Changes of pressure at ocean bottom
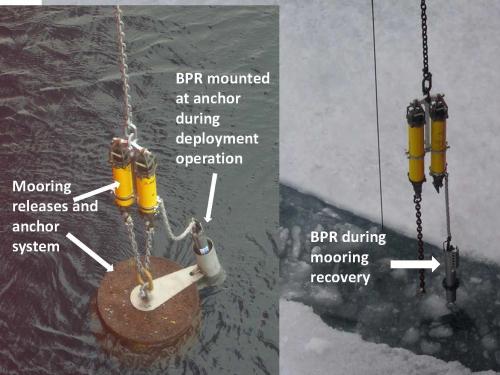
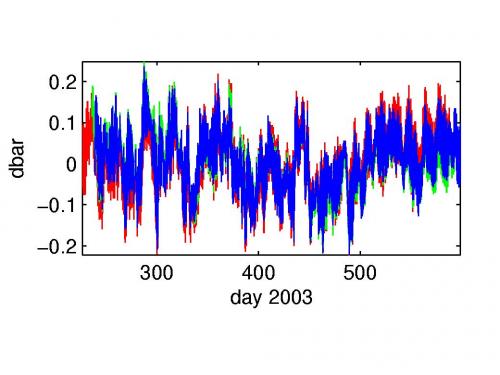
Since 2003, the bottom pressure has been measured by bottom pressure recorders (BPRs; Figure 10) at all BGOS moorings to investigate ocean dynamics. The bottom pressure data time series for each mooring have annual duration and sampling intervals ranging from 15 to 30 minutes depending on the instrument and the year. For the SBE-16plus BPRs, a measurement integration of 70 seconds will resolve sea level changes to better than 1 mm. All moorings' BPR data have practically no gaps and represent so-called “barotropic” component of sea level changes. These include signals of ocean mass variability over the instrument due to tides, precipitation minus evaporation, river runoff and water transports via open ocean boundaries (see Figure 11 showing bottom pressure changes recorded by instruments during one year). Note that different BPR’s data are shown in colors.
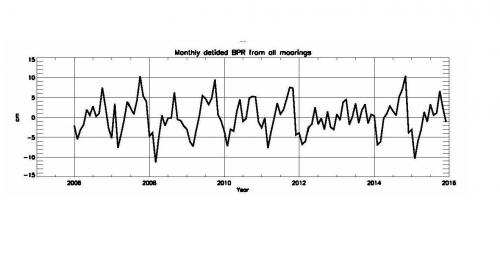
The bottom pressure information at each mooring is also analyzed to better understand changes of Beaufort GyreA spiral oceanic surface current driven by the wind. tidal constituents. The annual and monthly time series were used to calculate tidal parameters for major tidal waves and long period tides. The major conclusion from this analysis is that the Arctic tidal constitutes (even in the Beaufort GyreA spiral oceanic surface current driven by the wind. region) change seasonally and from year to year. This phenomenon is well known from the analysis of coastal tide gauge data in the Siberian seas. This variability is usually attributed to the changes of sea ice conditions influencing both amplitudes and phases of tidal waves via ice-ocean friction especially under land-fast ice. The seasonal and inter-annual changes of the tidal constituents are one of possible sources of uncertainties for satellite data corrections.
Other interesting finding from BPR data analysis shows that the seasonal cycle of sea level changes in the Beaufort GyreA spiral oceanic surface current driven by the wind. region resemble the mean sea level seasonal cycle at numerous coastal stations along the Siberian coast. This implies that the Arctic Ocean experiences practically-synchronic changes of its volume throughout its domain. One explanation of these changes may be associated with changing Arctic Ocean volume due to water fluxes via its connecting straits and passages to lower latitudes (Peralta-Ferriz et al., 2011).



Comments