DOC Characterization via Mass Spectrometry
Toolik Field Station, North Slope, AK
June 26, 2019
Video of the Day:
A small group of caribou woke me up from a nap on the tundra just north of the Brooks Range. Amazing animals to observe at such close range!
As a preface to this post, you’ll benefit from reading my previous entry on dissolved organic carbon (DOC). The focus of this entry is on one of the main methods used to characterize the organic components of DOC, mass spectrometry.
Mass Spectrometry
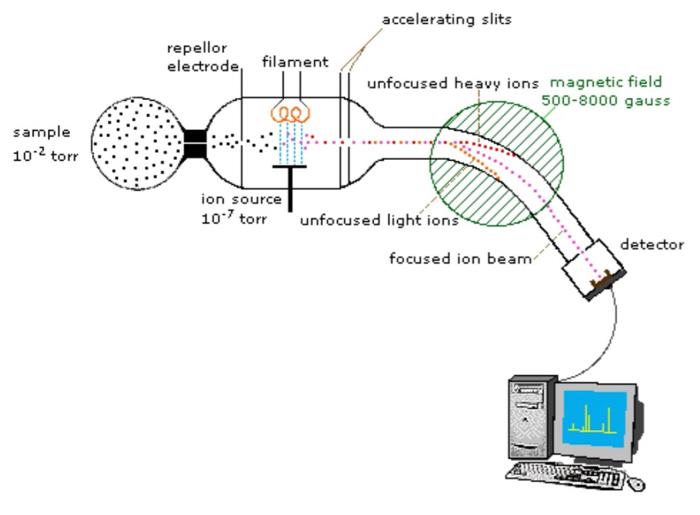
First, a bit on how this technique works. First, a given sample is bombarded with electrons, and its components are ionized. These ions are then accelerated into an electric or magnetic field, in which they undergo deflection. In the field, ions with the same ratio of mass to charge are deflected by the same amount. The separated ions are then detected, and results are displayed on a spectrum depicting intensity of signal (for detected ions) vs mass-to-charge ratio.12
Each bar on the x-axis of a mass spectrum represents an ion with its own mass-to-charge ratio (m/z), and the height of the bar on the y-axis indicates the relative amount of that ion present in the sample.2

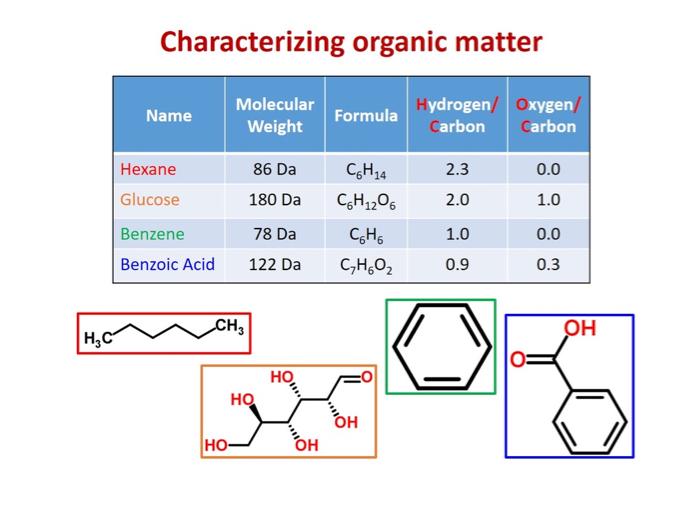
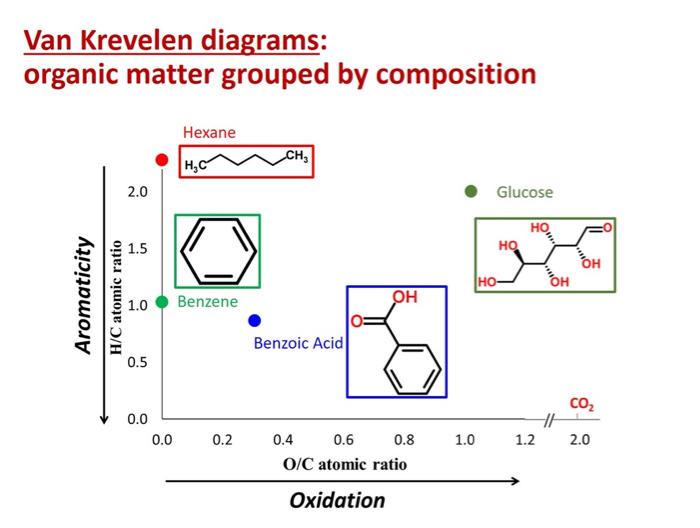
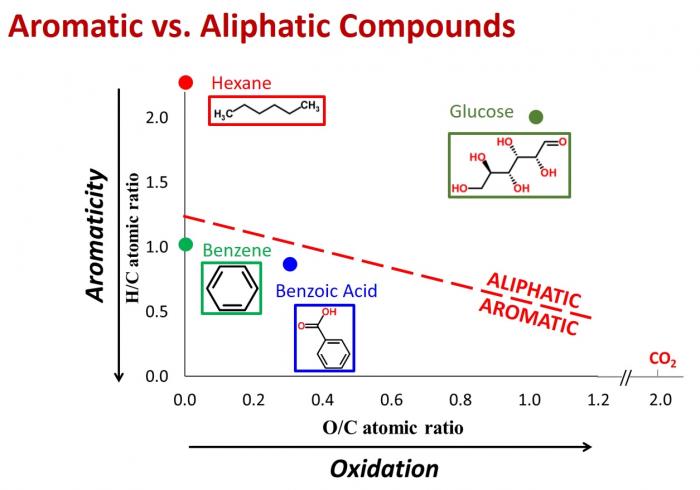
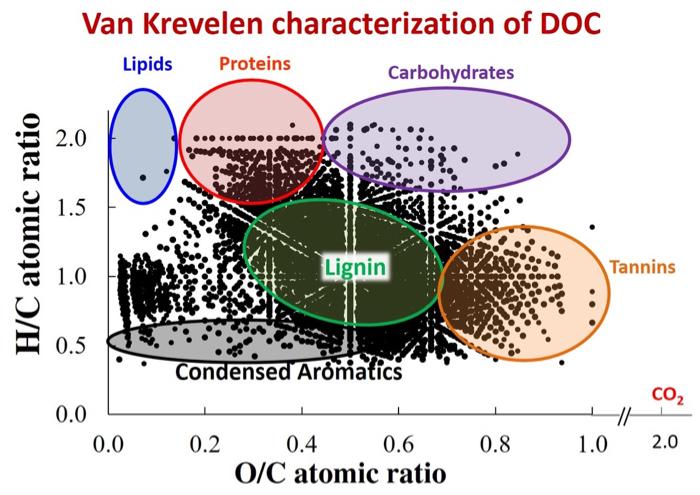
If you use a mass spectrometer with sufficiently high resolution, you can obtain the molecular weight, hydrogen/carbon ratio, and oxygen/carbon ratio for compounds in a mixture.12 Molecular weight, hydrogen/carbon (H/C) ratio, and oxygen-carbon (O/C) ratio can be used to determine compound class. Van Krevelen diagrams, which plot H/C ratio as a function of O/C ratio, are also very useful in graphically depicting the different components in a mixture.
DOC Characterization
Dr. Rose Cory’s lab has characterized stream DOC from the Arctic using high resolution mass spectrometry. Results suggest that DOC is a very complex mixture of organics, consisting of lignins, tannins, condensed aromatics, lipids, proteins, and carbohydrates.
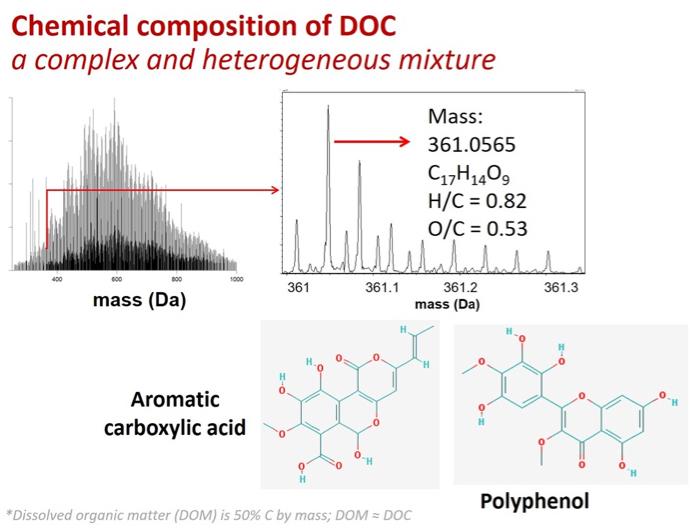
But even high resolution mass spectrometry is limited in terms of what it can tell you about the components of a given mixture, especially if that mixture is complex. As the below graphic illustrates, it is very frequently the case that multiple molecules have identical molecular weights, H/C ratios, and O/C ratios. Accordingly, while we know about the general compound classes that are present in DOC, we have yet to shed much light on the specific identities of the chemical components.
Comment below!


Comments