So far I've seen research being done to document types and prevalence of microbes in water systems, the characteristics of water at different parts in the watershed, and how what wavelengths of sunlight are found at different water depths. Each variable by itself presents interesting research questions. However, a more complicated piece is added to the puzzle - How does water flow affect carbon release into the atmosphere?
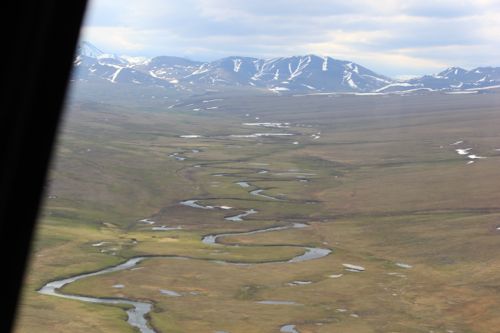
The Kuparuk River watershed includes Toolik Field Station and surrounding areas. The Kuparuk starts in the Brooks Range and ends in Prudhoe Bay and the Arctic Ocean.

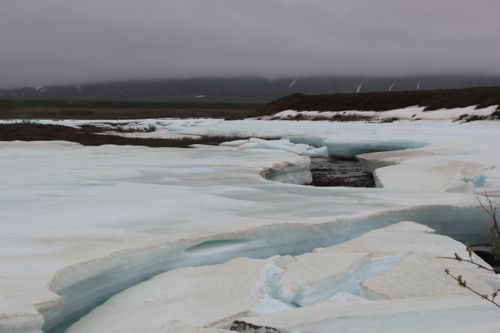
Like the tundra ecosystems, the Kuparuk has seasonal patterns. In winter, the river is frozen.

With spring's arrival, melted snow rushes downstream. The river goes from a solid mass of ice to a torrent of water. According to USGS river discharge data at Dead Horse, near the mouth of the Kuparuk, the river had a discharge rate of abouts 7,100 cubic feet per second in early June. (as compared to ~1,000 cubic ft/sec in July) This high volume of water doubled the driver's depth to six feet. (http://ine.uaf.edu/werc/projects/NorthSlope/upper_kuparuk/uk_river/current.html)
Dr. Cory and other scientists wonder how the river's fluid dynamics affect carbon in the water. They are designing studies to track water particles in a water column. Does water spend more time at the top of the water column where there is more light, or at the bottom, where it is darker? Water flows differently through deeper streams as compared to shallower streams. For example, in shallow sections, water and materials in water have more interaction with rocks and eddy currents.
Professor Beth Neilson from Utah State and her team are looking for answers to these questions. To be able to track water flow, Beth and her team flew by helicopter to river sites and dropped rhodamine into the water. This pink dye can be tracked to visualize water's flow patterns.
Here is a video clip of the tests:
http://
Dr. Neilson will collaborate with Dr. Cory and Dr. Aaron Packman, Northwestern University, to analyze the results from these tests.


Comments