My fingers are numb and my toes are throbbing with icy coldness. I am once again in the deep freeze of -21˚C with a significant head wind thanks to the fans. I am fully garbed in big red and five other layers as well as two pairs of wool socks and still, the cold finds a way to seep in. Thankfully, I can step in and out as necessary, unlike being in the field, but if I step out too often the work doesn't get finished. So, I stuff my gloves with hand warmers and keep myself moving. We work for two hours in the cold with breaks about every 20 minutes just long enough to warm up the fingers.
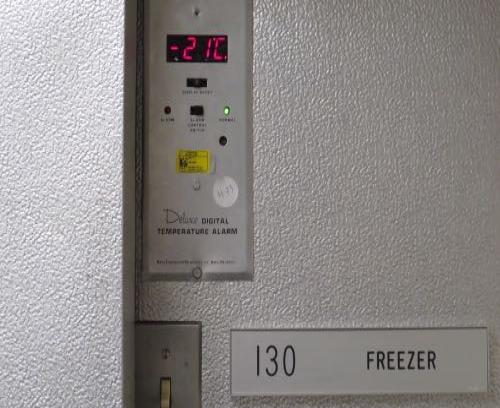
    Freezer temp
    A very cold room indeed!

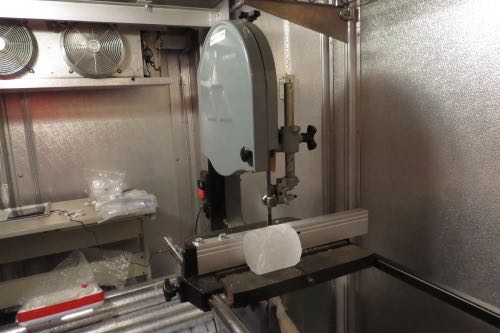
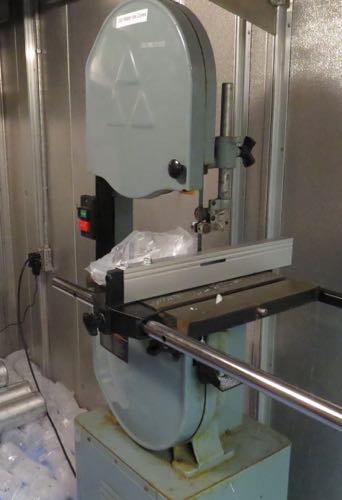
    Band saw
    A look at the band saw we use to cut the thin sections and half sections used for melting.

    workspace
    A look at the fans above our work space that keeps the cold air blowing right at our heads. Brrrr. You could develop frost bite in here!

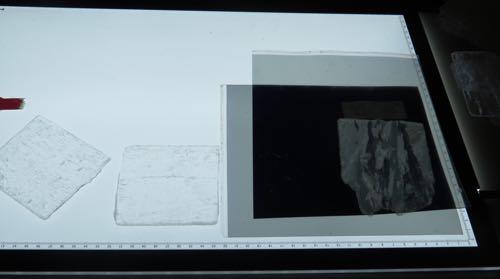
    What work is happening in the cold room? I am making thin sections of our ice cores and photographing them. Hongjie takes the thin sections and brushes them to remove debris and frost to reveal a 'clean' thin section before I photograph them under two dark shades/gels set at 90˚ angles. We also cut sections for Yongli to melt so he can run salinity, pH, conductivity and a few other stable isotope measurements outside of the cold room. Sadly, Yongli cannot spend time in the freezer. Our last field day yielded a nasty frost bite to his cheek, likely from riding his snowmobile with his helmet shield up to avoid fogging on the lens. We discovered it only after getting back from the field as his face mask covered any signs of it. He is recovering and will be okay with time, but it is a definite reminder of the harsh conditions that exist here and how quickly things can turn south.
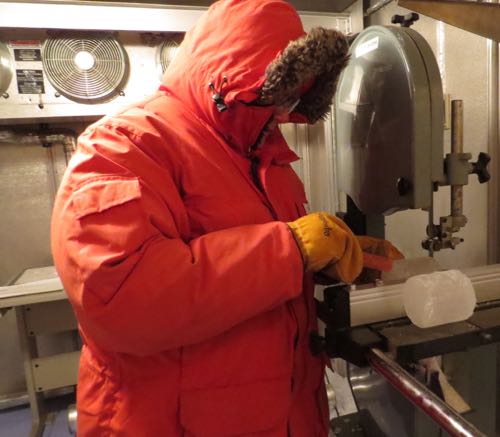
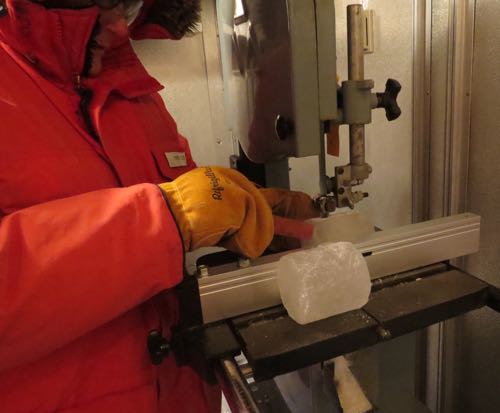
    Cutting the 1/2 sections
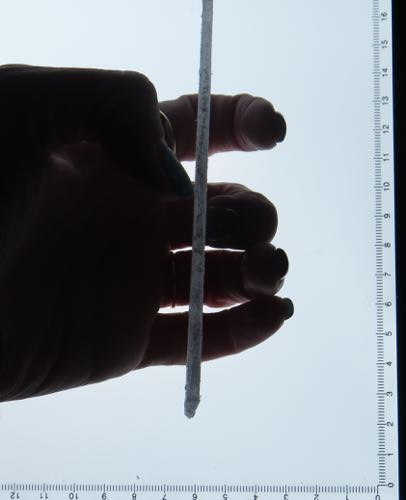
    Here I am actually using the saw to cut the cores in half and yes, I am wearing safety glasses.

    Close up cutting
    A close-up of my push stick, a plastic ruler. I guess that works.

    Light table
    Light table with our thin sections and gels.

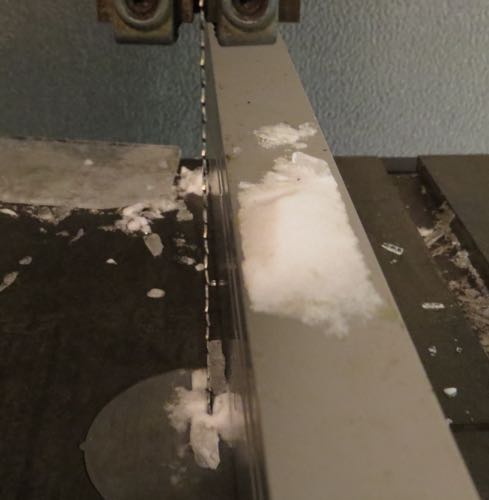
    Blade on saw
    Blade on the saw with guide set at about 3mm.

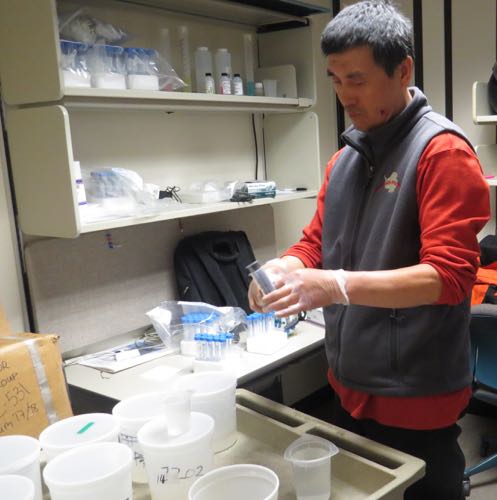
    Our office/lab set-up
    Here is our office/lab set-up. Yongli is taking his samples while Hongjie is crunching data at the computer.

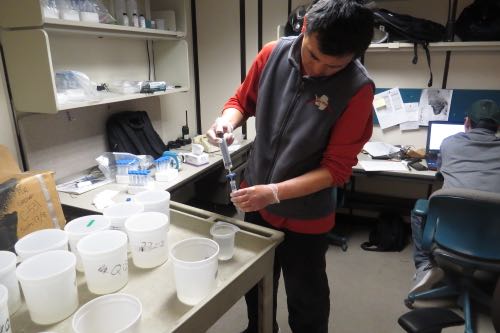
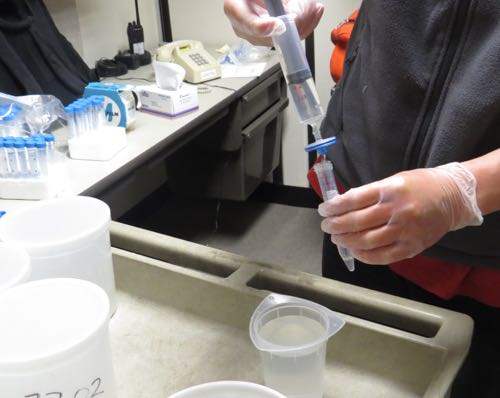
    Water injection into collection tubes
    Yongli is injecting water from the melted cores into collection tubes for measuring stable isotopes.

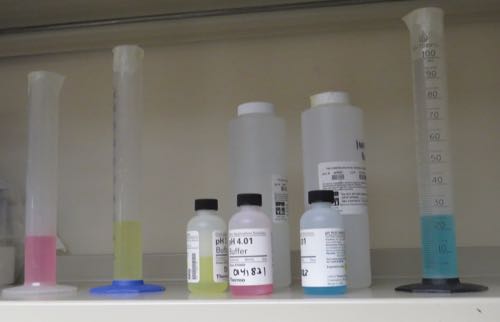
    Chemicals
    Chemicals for calibrating our tools!

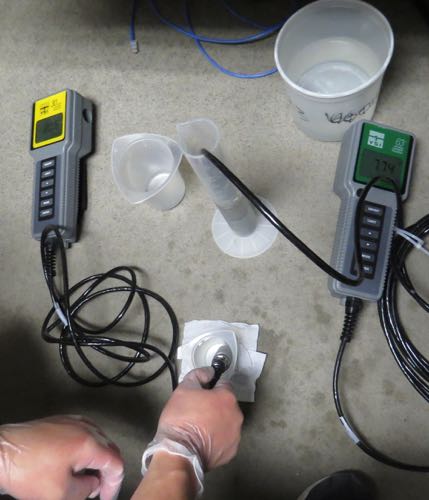
    Taking salinity
    Yongli is taking salinity/conductivity and pH measurements in this pic. Our lab space is limited to our office as we have the cold room work area, but due to Yongli's frost bite, cannot conduct his work here not to mention the samples need to melt to run these tests so, to the office they go!

    Another Yongli pic
    Yongli, taking his work very seriously!

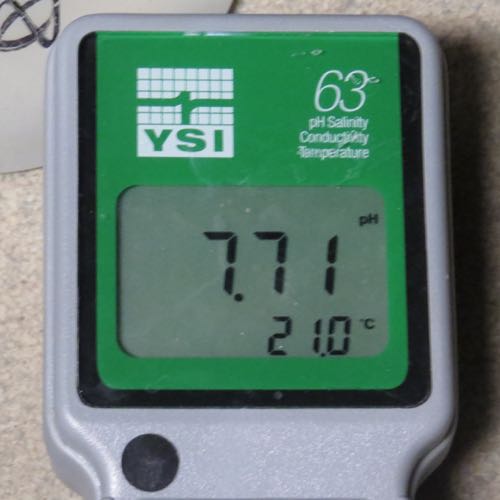
    Probe
    A close look at the probe read-out for pH in this case.

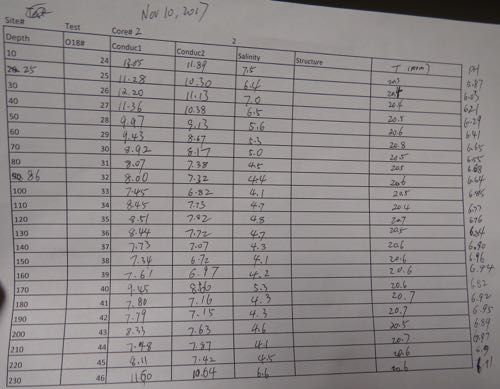
    Data table
    One of the data tables for the all the measurements being collected from the probeware.

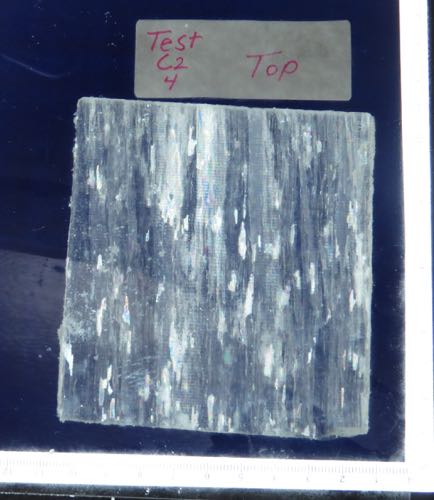
    Today's images are of our lab work from the cold room. I am trying to perfect my technique on using the bandsaw. Cutting thin sections often results in broken pieces that are not usable. Ice breaks fairly easily when it becomes thin and "dry" and at -21˚C, there is no moisture to be had, everything is frozen including the brine (salty water that has a much lower freezing point). How thin can I get while keeping the section intact? That is my challenge. Thinner sections give better pictures and one can more readily determine the ice structure as to columnar, platelet or granular ice and can show where the brine channels are located as well. I am not exactly sure where all of this information will lead, but I do know we are creating a better map/picture of the Ross Sea Ice that will help us to determine how it is changing over the course of seasons and years. That in turn will hopefully help scientists understand the implications of climate change in this area.
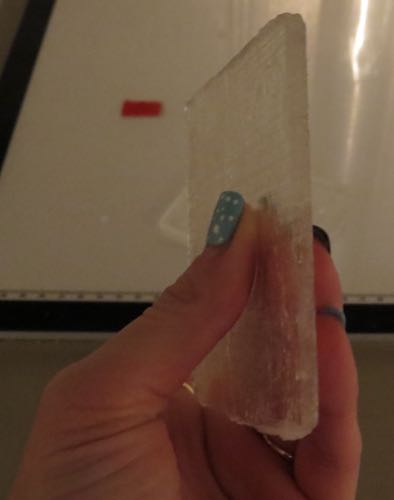
    Thin section width
    Fairly thin section, about 4 mm. Ideally, 2mm would be best.

    Thin section 4
    Thin section about 40 cm down from the top of the ice. You can make out a lot of columnar ice with a few brine channels in this pic.

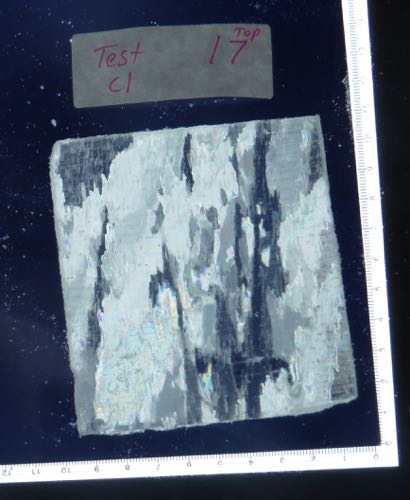
    Thin section 17
    Another thin section at 170 cm down from the top of the ice. Note the changes in the crystal pattern. We are starting to see more platelet ice in this section.

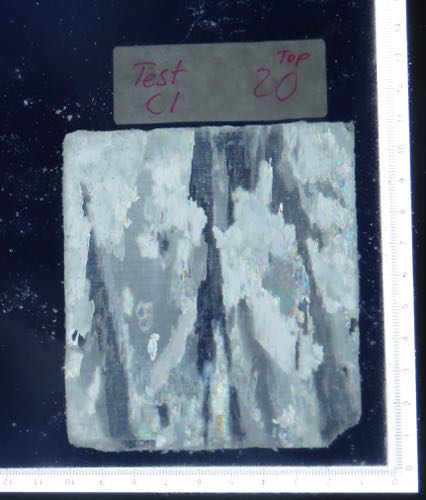
    Thin section 20
    Almost at the bottom, 200 cm down. Significant brine channel at the top.

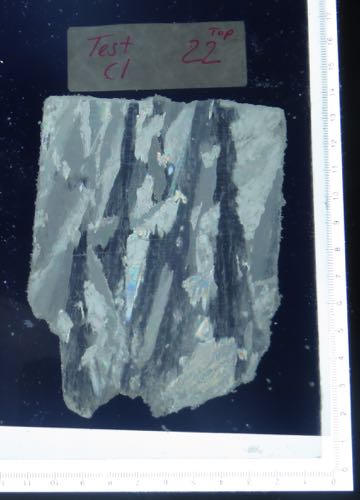
    Thin section 22
    Last section 220 cm down. The very bottom was submerged in sea water and is all platelet ice that is now completely frozen due to the cold room temp. Lots of platelet ice crystal and brine channels allowing the brine (salty water) to escape into the sea!

    Thin Section 2mm
    Practice makes perfect. Down to 2mm of thickness. Very fragile!

    Flat Lorax was cold too and decided to warm-up by joining the McMurdo baseball team! He didn't even have to miss any field trips for tryouts! Cards today are for Jonathan in 1st grade and Bryce in APBio who was also in APES last year and will hopefully chuckle over this post!
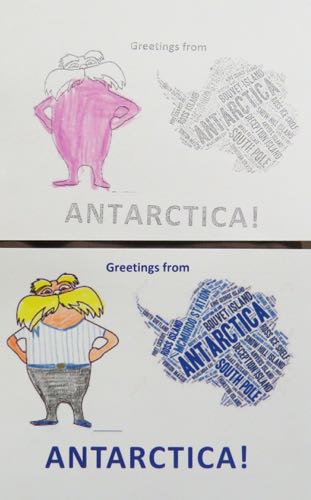
    Flat Lorax Post Cards
    Flat Lorax postcards for Jonathan in 1st grade and Bryce a former great APES student and a current APBio student!

    Date
    Location
    Crary Lab, McMurdo Station, Antarctica
    Weather Summary
    Mild, Sunny and Clear but with a storm approaching!
    Temperature
    16˚ F
    Wind Speed
    16 mph
    Wind Chill
    6˚ F

    Comments

    Neville Nazareth

    That is so cool that you are part of a team that could help scientists understand climate change! How fascinating! I love that you included the data tables - looking at them makes me feel reassured that crossing stuff out and adding more columns is okay!
    Cutting those ice cores must require a lot of patience, because of how fragile it is and how precise you have to be to get it to 2 mm. That is very admirable and impressive!

    As a quick question, are there any other factors besides salinity and pH that you could use to map the Ross Sea Ice and thus hopefully understand climate change?

    Jennifer Bault

    Hello Neville,
    Nice to hear from you again. I appreciate that you are taking the time
    to read the journals and ask questions! The data tables here are
    actually pretty messy a lot! They eventually get retyped but in the
    field and even in the lab, we all make mistakes and end up crossing
    stuff out and rewriting!

    The thin sections do take a lot of time. If I break them, I have to
    recut them and there is only so much ice core. It is a nerve-racking
    process! I would hate to screw up and not be able to get a pic as a
    result of my errors.

    I think there are many avenues that are being explored in terms of
    establishing a great set of baseline data within the Ross Sea. Some
    people are measuring various aspects of the water below the ice and
    others, like our team, are helping to map free board and snow board as
    well as ice thickness, extent, multi and single year ice!

    Once the entire baseline picture is complete, they can then start to
    assess impacts year to year as a result of climate change! Currently
    however, there is just not enough of the baseline data to develop an
    accurate "beginning" pic.

    Two more weeks! See you soon,

    Mrs. Bault

    On 11/11/17 5:13 AM, PolarTREC wrote:

    Thomas Nguyen

    Hi Mrs. Bault!
    As Neville stated before, cutting the ice sheet to 2 mm is really awesome!

    In the cold room, were there any other tools in the cold room other than vertical band saw? How hard was it to guide the ice core with the gloves on? How many attempts did it take to perfect one of the ice sheets?

    As for the office lab tests, how would you measure the stable isotopes (Carbon, Oxygen, and Uranium) of the cores? What could conductivity measurements of the ice cores indicate about the Ross Sea Ice cores (perhaps concentration of salt in the brine samples)?
    And is there any existing trend data about conductivity, pH, salinity, and/or temperature of the ice over time?

    Final set of questions (the presentation from several days ago…sorry :))… Yongli’s discussion about deuterium was really interesting, but I’m still a little confused on what the symbols (18O…carbon 18) and what the trend indicates. I see there are four regression lines (and the equations for those four lines on the right), but what does each line represent and how can the study of deuterium contribute to the study of sea ice levels in Antarctica?

    Cheers!

    Thomas

    P.S: Was this part pun intended (south...)?
    "He is recovering and will be okay with time, but it is a definite reminder of the harsh conditions that exist here and how quickly things can turn south."

    Jennifer Bault

    Hello again,
    more great questions! Keep them coming.

    There is a table on which to work and the light table. Otherwise the
    cold room is basically a freezer with shelving on one side and a power
    outlet. If you were in need of other tools, certainly they could be
    brought in. It just depends upon the needs of the team. The lab techs
    here get it ready for you!

    Gloves make everything more difficult. It is clumsy but you wouldn't
    dare work without them for heat reasons but also for safety! The
    guiding of the ice cores is not terribly difficult but getting the thin
    sections to emerge without breaking apart is much more difficult!

    I have still not perfected the thin section slicing. You can actually
    feel the ice breaking as it goes through the blade. Slow and steady
    seems to be the best, but if you catch a snag, chances are you will have
    to start over. I get lucky a lot and sometimes make it through with
    just one try. I started with 5mm sections and have worked my way down!

    Picarro (L2130-i analyzer) is the name of the device used to sample and
    determine isotope measurements. The water samples are being shipped
    back to the University of Texas San Antonio (UTSA) for this analysis.
    You can look this equipment up on-line and get all of the pertinent
    information about how it works!

    Conductivity is very much related to the measure of the salinity and
    it changes depending upon the depth of the core. We are taking salinity
    measurements every 10 cm down the length and at the top salinity is is
    about 6 parts per thousand and in the middle about 3-4 while at the
    bottom around 6 again. The sea is about 35 parts per thousand!

    We are collecting these measurements to get a good set of baseline data.
    Right now, it doesn't exist so we can't see trends at this point at
    least not more than a couple of years of annual sea ice which is not a
    good overall picture. All the more reason to collect this data!

    As far as the deuterium question, I will forward this to Yongli and let
    him answer that for you!

    The pun was actually not intentional, but now that you pointed it out...

    Penguin video is now properly uploaded. I had some difficulty uploading
    the high res. video so the quality is quite poor, but it is there!

    See you in a few weeks,

    Mrs. Bault

    On 11/12/17 10:03 AM, PolarTREC wrote: