A Berry Good Beginning to the Day
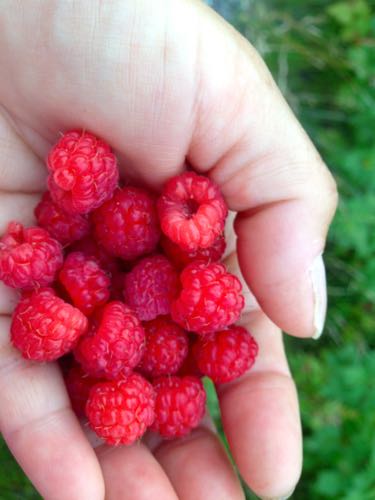
I did not know whether I would find raspberries this far north. I had not seen any on my trek through boreal forest or tundra. But like in most northern places, the road side is a good place to find them. This morning on my walk to work, I discovered a large raspberry patch which I will pick clean for our breakfast.
Research Site Layout
Thanks to Emily and Marguerite's patience, I am beginning to understand how the site has been laid out. They each provided me with a map, as I was struggling with the oral explanation.
As you may recall from an earlier post, fences are erected in the winter. Two fences collect snow on the north side of each of three replicate plots, named A, B and C. The snow collected behind the fences act to warm the tundra. The control (non-warmed) plots are located on the south side of each replicate.

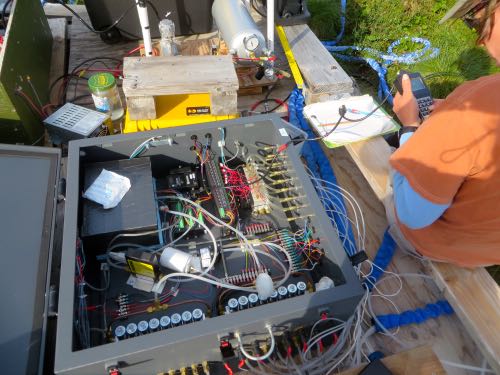
Systems Check
Each day in the field begins with a systems check. A systems check ensures that the data being collected is valid and true. Sometimes, the system is running smoothly, but it seems that on the whole, the rather complex electronic system that CiPEHR relies on, needs adjustments and repairs on a daily basis. Today, the temperature probe for one of the plots was reading far too low (-2 C)! So Marguerite had to ferret out where the problem was occurring in the system. After a long while, she discovered that the faulty reading resulted from a disconnected wire.
Depth to Water Table
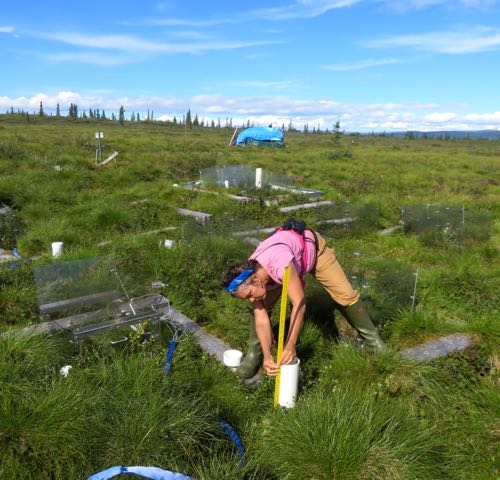
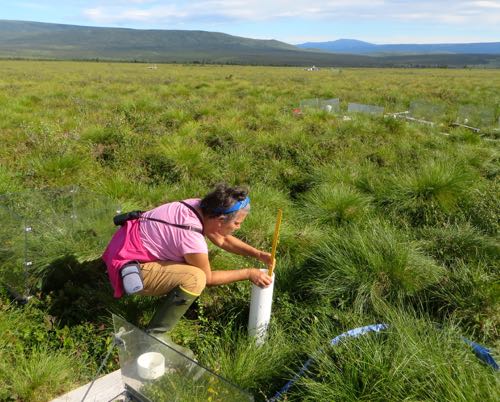
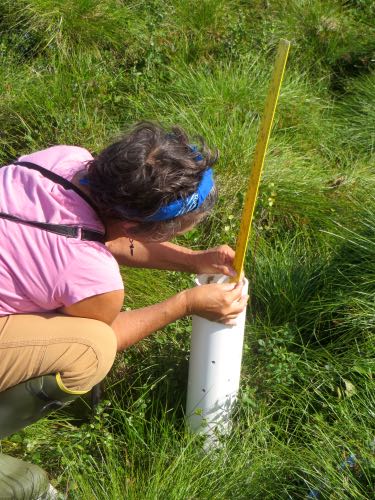
While Marguerite spent the morning sleuthing the cause of the temperature probe malfunction, I was gainfully employed collecting the 'depth to water table' data. As the tundra soil warms, the location of the water table will change. The change of water table over time is valuable information to understand both the dynamics of ecosystem function, as well as carbon flux. 'Depth to water table' data is collected three times a week in the summer months.
Wells
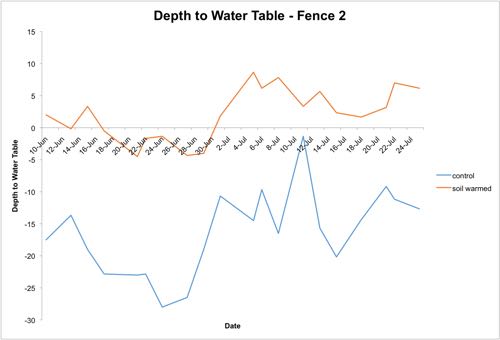
I collected data for 5 wells per snow fence. At each well, I measured the distance of the soil surface from the top of the well and the distance from the surface of the water to the top of the well. Subtracting the distance from the soil surface from the distance from the surface of the water, gives you the water table depth. As you can see from the graph below, the water table in the soil-warmed tundra is rising. Values on the graph located above the zero line are places where the tundra is becoming a pond!
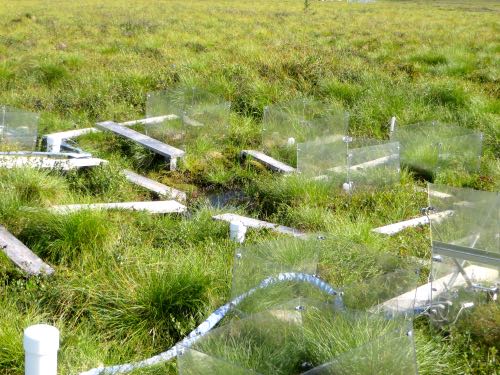
Another very obvious visual cue of thawing permafrost is subsidence. The land sinks as it thaws. The spaces that once held solid ice begin to collapse, lowering the surface of the land. Water in the liquid form takes up less volume than solid water.
A Moose to Wish Me Good Night
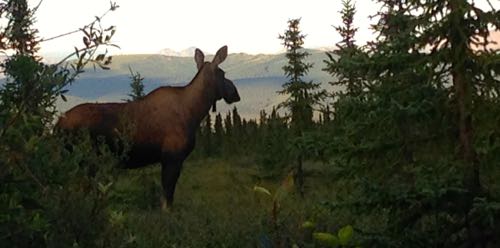
On my way home tonight, a young moose crossed the road in front of me, a lovely way to end the day!


Comments