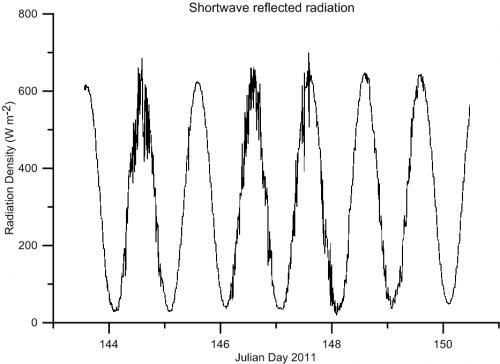
So what exactly are the BSRN and AWS and what do they do? Well, in today’s journal, I am going to show you what each instrument on the BSRN and AWS looks like and what it measures. I will also share with you some graphs of the data that each instrument recorded. Dr. Steffen and Nikko prepared graphs from data they acquired from the Summit Station BSRN and AWS.
If you have been following along on my expedition, you might recall that the first five days in the field, we serviced ten AWS stations and made a total of 19 landings and take-offs in the ski-equipped Twin OtterA highly maneuverable utility aircraft developed by de Havilland Canada. It can be flown slowly and in tight circles, and is designed for 20 passengers, short takeoffs and landings, and often used for cargo, passengers, and as a science platform.. Each station had its own agenda of repairs and/or data downloading to be done. Now that we are at Summit Station, I can show you what each of the instruments does and what the data looks like in graph form.
First, lets take a look at the Baseline Surface Radiation Network (BSRN). Solar radiation is the major energy source that drives our climate and supports life on earth. The measurements are part of an international effort to record accurate radiation values called the Baseline Surface Radiation Network project. The data collected will be used to further study the Greenland Ice Sheet and it’s processes such as melting and gas exchange with the atmosphere. These measurements are used to calibrate climate model runs or satellite sensors.
Studying heat balance is an important concept in climatology because bright surfaces, like snow, reflect more radiation back into space while dark surfaces, like water, absorb more radiation. When you have snow cover, about 90% of the solar energy that goes through the atmosphere is reflected back into space. But increasing the amount of water on the Ice Sheet causes less radiation to reflect and more heat to be absorbed. This increases the temperature and causes more ice to melt.
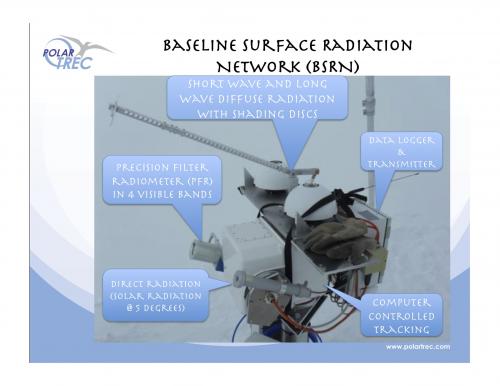
The BSRN has four instruments on it, all recording various forms of radiation.

The energy absorbed by the surface is radiated from the Earth as terrestrial longwave radiation (L↑). The amount of energy emitted is primarily dependent on the temperature of the surface. The hotter the surface the more radiant energy it will emit. The gases of the atmosphere are relatively good absorbers of longwave radiation and thus absorb the energy emitted by the surface. The absorbed radiation is emitted in all directions with the downward directed portion being longwave atmospheric counter-radiation (L↓). The difference between incoming and outgoing longwave radiation is net longwave radiation expressed as: L* = L↓ - L↑


About 30% of the available solar radiation at the top of the atmosphere is reflected or scattered back to space by particulates and clouds before it reaches the ground. The gases of the atmosphere are relatively poor absorbers of solar radiation, absorbing only about 20% of what is available at the outer edge of the atmosphere. The remaining solar radiation makes its way to the surface as direct and diffuse solar radiation. Direct solar radiation (S) is shortwave radiation able to penetrate through the atmosphere without having been affected by constituents of the atmosphere in any way. Diffuse radiation (D) is shortwave radiation that has been scattered by gases in the atmosphere. Scattering is a process whereby a beam of radiation is broken down into many weaker rays redirected in other directions; this is why the sky is blue. Together, direct and diffuse shortwave radiation accounts for the total incoming solar radiation or insolation (K↓). In equation form: K↓ = S+D

The Automated Weather Station collects data related to current weather conditions and can be used to track climate related data due to it’s well documented data collection beginning in 1990.
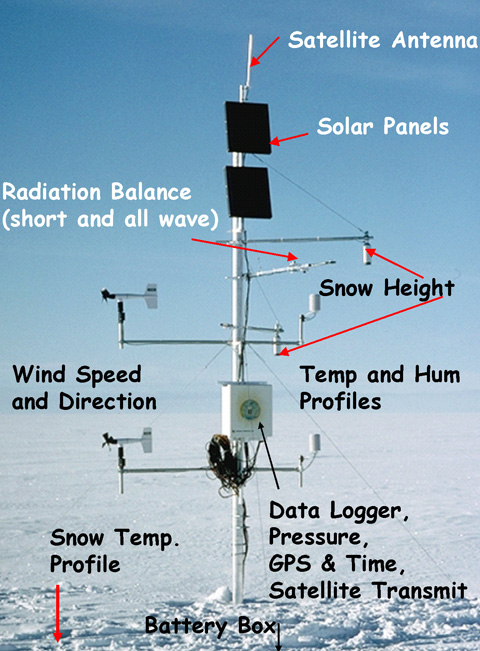
There are 18 stations on the Greenland ice sheet. They were placed in those areas to study the climate variability of the ice sheet and to provide better data for climatologist and meteorologists.

On each station, multiple instruments record and transmit the average weather conditions in 1-hour increments via satellite to the University of Colorado at Boulder.
The first AWS instrument we will look at is the Anemometer or “bird”. The anemometer measures wind velocity and direction. The wind velocity is measured by how fast the propeller spins due to the wind. The wind direction is measured by aligning the fin on the of the instrument with the wind direction.


The next instrument we will look at is the sonic sensor. The sonic sensor measures surface height of the snow to the sensor using sound waves. This can be snow accumulation or snow melt. As temperature changes, so does the speed of sound, so you will notice fluctuations in snow height in a 24hr period. Question: Does sound travel faster or slower in cold air?
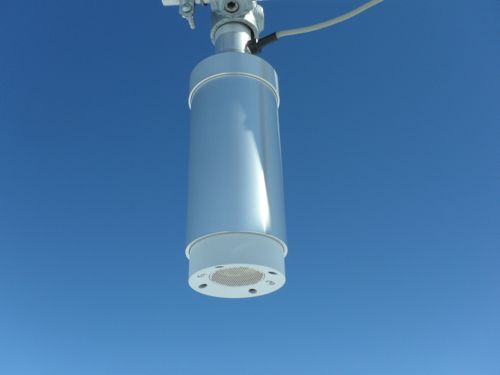

Next we will look at the instrument that measures relative humidity and temperature. Relative humidity is a measurement of the amount of water vapor in a mixture of air and water vapor. It is most commonly defined as the partial pressure of water vapor in the air-water mixture, given as a percentage of the saturated vapor pressure under those conditions. The relative humidity of air thus changes not only with respect to the absolute humidity (moisture content) but also temperature and pressure, upon which the saturated vapor pressure depends. Relative humidity is often used instead of absolute humidity in situations where the rate of water evaporation is important, as it takes into account the variation in saturated vapor pressure.
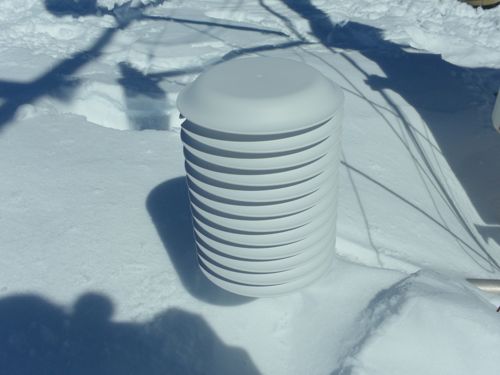

Temperature is a physical property of matter that quantitatively expresses the common notions of hot and cold. A thermocouple measures air temperature and is mounted in the radiation shielded cylinder. A thermocouple is a junction between two different metals that produces a voltage related to a temperature difference.

Atmospheric pressure is the force per unit area exerted against a surface by the weight of air above that surface in the Earth's atmosphere. The pressure sensor is located in the data box on the AWS. In most circumstances atmospheric pressure is closely approximated by the hydrostatic pressure caused by the weight of air above the measurement point. Low pressure areas have less atmospheric mass above their location, whereas high pressure areas have more atmospheric mass above their location. Similarly, as elevation increases there is less overlying atmospheric mass, so that pressure decreases with increasing elevation. A column of air one square centimeter in cross-section, measured from sea level to the top of the atmosphere, has a mass of about a kilogram and a weight of 63N (and a column one square inch in cross-section would weigh about 14.7 lb).

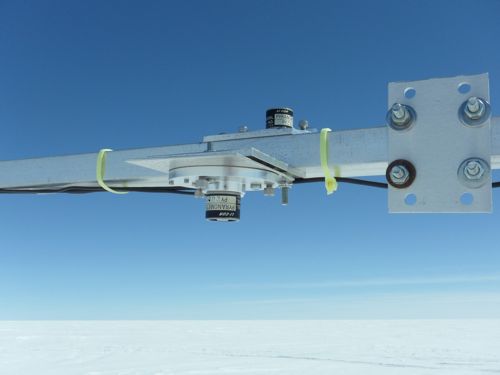
The AWS also measures solar radiation. There are three sensors that measure solar radiation. They are incoming and reflected short wave radiation, and net wave radiation.
About 50 percent of solar (or shortwave) radiation is reflected back into space, while the remaining shortwave radiation at the top of the atmosphere is absorbed by the earth's surface and re-radiated as thermal infrared (or longwave) radiation.
Incoming solar radiation that strikes the earth's surface is partially reflected and partially absorbed, in proportion to surface reflectivity (albedo). Darker surfaces have a lower albedo and absorb more solar energy than do lighter surfaces. The albedo of a surface is also a function of the incidence angle of solar radiation (that is, the amount of solar energy a surface absorbs will depend on the solar altitude). Newly fallen snow has an albedo of approximately 0.90, meaning that it reflects about 90 percent of incoming radiation. In contrast, melting snow has an average albedo of 0.50, meaning that it absorbs 50 percent and reflects 50 percent of the incoming radiation. Because a darker surface absorbs more solar radiation, snow covered by dust (dirty snow) melts faster than clean snow. The albedo of sea ice varies with ice age, but when snow covered is on the order of 0.70.


As you can see, the BSRN and AWS provide a significant amount of data to help us better understand weather and climate, on the Greenland ice sheet and on a global scale. If you have any questions about the AWS or BSRN, please go to the Ask the Team section.
Up next, an interview with Dr. Konrad Steffen


Comments