I am sitting in the second day of the OASIS meeting of scientists at UC Davis, California. We have 32 scientists from many different organizations in the United States, Canada, England, France and Germany discussing their data and results from their 3-month Arctic campaign.
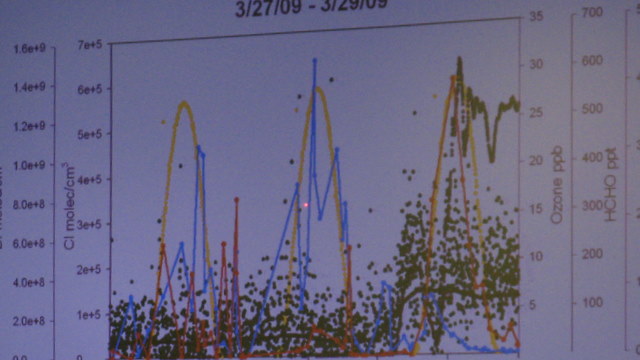
One of the things I stress to my seventh grade students is the importance and "beauty" (I know I'm a little weird to them) of graphing out data. The last two days have been filled with all kinds of graphs!!! It is a science teacher's dream. The scientists have plotted their data with all kinds of other data obtained by other scientists overlaid. Lee Maudlin, an NCAR scientist, pointed out that oftentimes he just starts plotting data sets to see what shows up. You can't really tell what you know until you plot things out and see what correlations you can find.

They have been showing these graphed results, and discussing what happens next. Writing and publishing papers, the lifeblood of scientists, are discussed. Many of the graduate students in the room are going to be incredibly busy as they help author these papers.
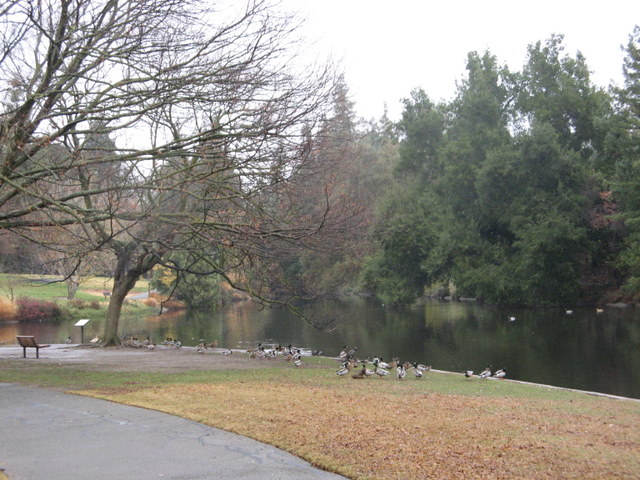
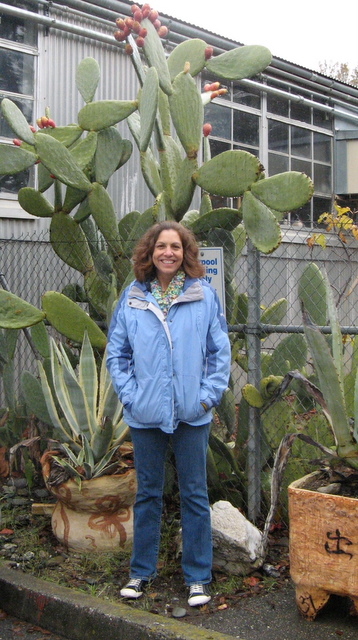
Holly Reay and I enjoyed the cold rain during a walk at lunch.


Comments