This journal is flying hot off the press this am in hopes that anyone checking out Al Werner's webinar can also have a chance to see some real data comparisons. We are heading out to the field quite shortly but I thought I may be able to fire off a quick graph and select images. This short data exhibition is a brief teaser along the lines of a similar lesson plan that is in the works for the coming academic year…
This first graph is a compilation of mooring data from our 'C' location rather close to the Linneelva inlet to Lake Linne. This record shows a great version of the ice-out melting progression of the lake. On it, you'll find the x-series data is a simple timeline with multiple y-series data graphed in large and gaudy colors (my apologies for lack of scientific taste for 'crayola in your face'). C4 through C1 represent temperature probes stationed at various heights in the water column with C4 being the shallowest and C1 the deepest. TOR and BOR stand for 'top of rock' and 'bottom of rock' respectively, showing the temperatures just above and below our rock anchor at the bottom of the lake (~15 meters deep or so). The temperatures are all expressed in celsius…SI here.
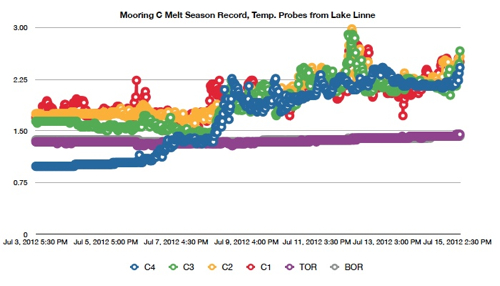
Just by looking at the graph alone can you see any trends? Of particular note are fluctuations in the blue…which probe is that again? Why might it start the lowest and then rapidly rise more than others?
Why are the purple and gray graphs so consistent?
What is so interesting about the anomalies occurring between July 12 and the 13th?
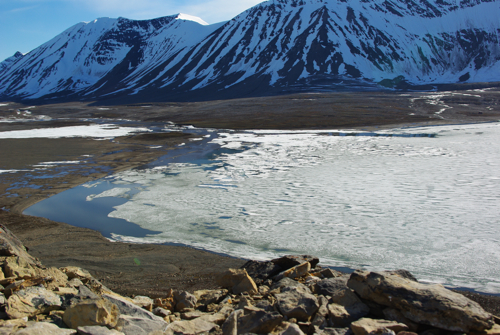
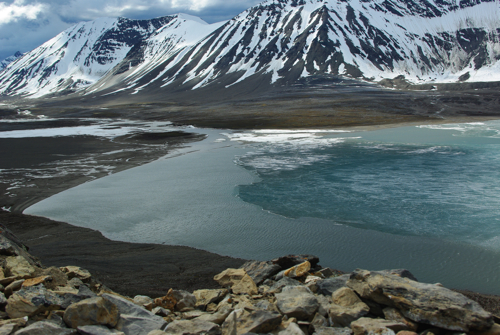
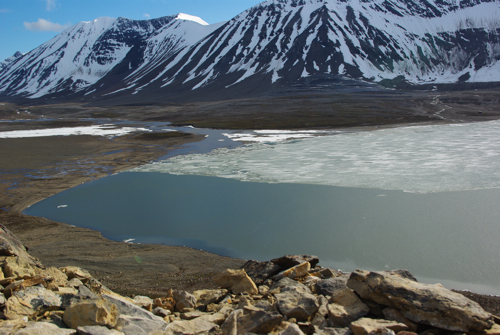
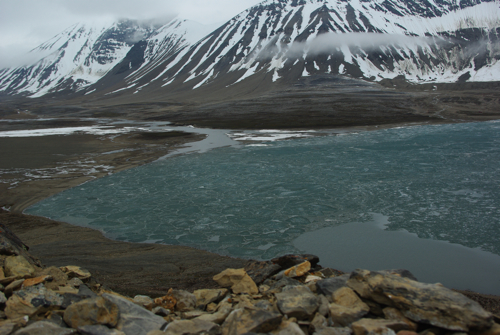
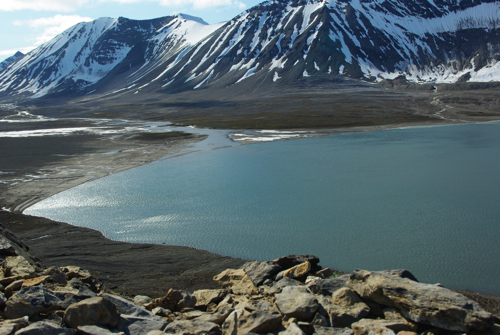
To help you think and start answering such questions I've included images from our plume cam, looking to the Linneelva inlet near where the C mooring is located. They span the time record of the graph and may be most telling…happy hunting, pay close attention to picture and graph dates, and I'll address some of the questions in the near future…Please post on 'ask the team' if you have any ideas and I will later share my own…


Comments