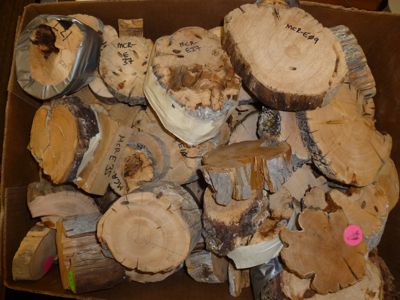
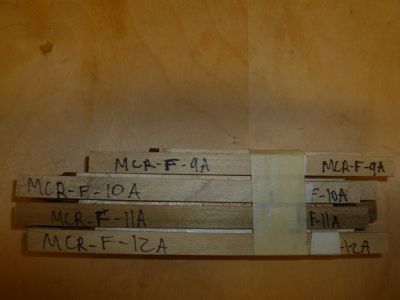
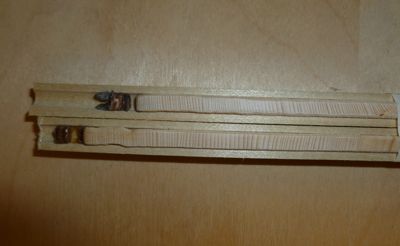
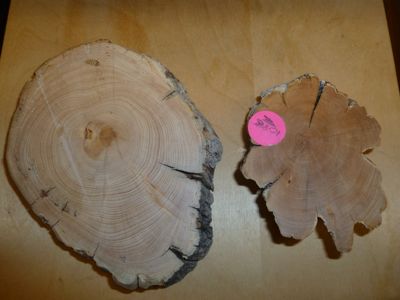
It’s been 9 ½ months since we sampled the White Spruce trees near Mancha Creek. During that time the samples have been stored at the Tree Ring Lab at the Lamont Doherty Earth ObservatoryA location used for observing terrestrial and/or celestial events. near New York City. The cores taken from live trees and the ‘cookies’, slabs taken from ‘sub-fossilized’ (aka downed and dead) trees, were planed and sanded so that the rings and ring patterns were easily discerned under the microscope. A technician spent countless hours counting the rings and measuring the width of each ring, compiling an extensive database from all of our samples. This week I visited to the lab to meet with Kevin Anchukaitis to review the data that has been obtained and to learn how that data will be used to further analyze our changing climate.


The first step in analyzing our samples was drying and sanding one surface of each core and ‘cookie’ so that the rings were clearly visible under a microscope. Then, the ring numbers and widths were measured for each core from the live trees. Each year’s ring width gives a glimpse into growing conditions for that year. In general, more favorable growing conditions result in more annual wood growth.

The next trick is to compare those ring and growth patterns with the patterns from the slabs or ’cookies’ cut from dead trees. While the ‘cookies’ are older than the live trees, there is usually some overlap in ring width and pattern between some of the cores and some of the slabs. Once you get a series of rings identified, you keep moving backward into the past as you link together the multiple series of ring width patterns. The theory here is that the live trees provide the most current glimpse into climactic conditions and growth patterns, while the overlap between cores from live trees and the slabs from dead trees can give you a chance to travel back in time to examine growth patterns on a much longer time scale. Some of the live trees we cored were well over 100 years old—no small feat for a tree living in such a harsh environment. Amazingly enough, one of the dead tree ‘cookies’ dated back to 1068. It’s sort of like a wooden time machine!

Think about it. What was going on in the world while some of these trees were just starting their lives? Two years before our oldest tree began its life, the Battle of Hastings raged in Europe. When the tree died, in 1350, the Black Death was first found in Scotland. Another tree began its life in 1502, the same year that Columbus landed in what is now called Honduras. In 1710, at the end of that tree’s life, it is estimated that Beijing was the most populous city in the world. Holding those tree slabs gives you a chance to hold a little bit of history in your hand.
The real work begins after this extensive database is compiled. The first step is to use a program known as COFECHA. COFECHA is used to check the cross-dating and overall quality of tree-ring chronologies. You can find out more about the program on the NOAA website http://www.ncdc.noaa.gov/paleo/treering/cofecha/userguide.html. The program smooths out the data, selecting for larger amplitude differences, instead of allowing the yearly variability to dominate your analysis. The first test that we ran examined the data to make sure it was ‘quality data’ with sufficient depth and breadth to allow further statistical analysis. Our data passed this first test, so it was on to some of the other statistical tests.
As Kevin ran through these statistical manipulations I quickly realized that a) I should have paid more attention in my college statistics classes so many years ago and b) computer-driven data analysis is an amazing tool! One analysis allowed us to ‘detrend’ the data in an attempt to draw out the climate driven data from merely event-driven data. That is, we were looking for trends instead of single events. In the world of climatology it is important to remember that climate is made up of a wide array of annual weather events that may not always be consistent. I always tell my students that climate is what you hope for while weather is what you dress for.
Each successive analysis allowed us to examine our local data against regional and global data for White Spruce. We used an online database and analysis tool known as ClimateThe average weather over a particular region of the Earth. Climate originates in recurring weather phenomenon that result from specific types of atmospheric circulation. Explorer (http://climexp.knmi.nl/start.cgi?id=someone@somewhere) during this process. We also tried to access long-term weather data from the closest weather station, a station in the Yukon near the village of Old Crow. There’s an amazing amount of long-term climate data on the internet if you know where to look.
So—by now I know you’re wondering just what we found out about our site on Mancha Creek. Growth data from ‘our’ trees was consistent with data that was obtained in 2002 from a site near the Firth River approximately 15 miles away. This is because White Spruce’s growth response to climactic events is fairly consistent over large geographic regions. In both sites, the relationship between temperature and growth is not as stable after 1960 as it was prior to that time. Are there other factors affecting these trees as the arctic climate changes? Is there a correlation between tree growth and moisture or is there some other variable that needs to be factored into this analysis? It will take more in-depth data analysis and research to answer this question.
I came away from my visit to the lab with an even greater appreciation of the complexity of both tree ring analysis and climate change. This is, as Kevin says, “cutting edge science.” If you wish to learn more about the Tree Ring Lab and the difficulties and complexities of correlating tree ring growth with temperature, you can read the paper that I’ve uploaded to this site entitled Timelines in Timber: Inside a Tree-Ring Laboratory.
- < prev
- 19 of 19


Comments