In today's world of climate change or global warming or whatever you call it, the use and transport of carbon has become a world famous logistics problem. Humans do not make all this new carbon and then decide to just dump it in to the air. The carbon has always been here. It's locked up in the wood of trees, in the bodies of animals, in the coal and oil underground, and in the air that we breath. The natural cycle of things needs the carbon in all of these places. That is the balance of the planet, and that balance shifts on its own, in a very natural way. That is part of what Dr. Natali is studying and attempting to measure, the movement, or balance, of carbon in a natural setting.
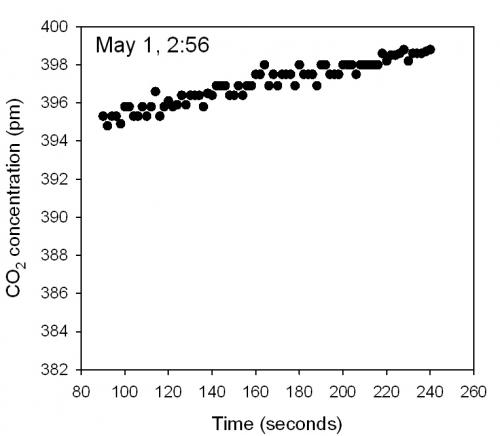
The first graph that I am showing here is from the data taken at our sit on May first of this year. The sample was taken by one of the flux chambers at 2:56 in the morning. Even though the sun is coming up here in Alaska around 5 a.m., it is still pretty dark at 3 in the morning. The plot shows an increase in the CO2 levels from about 395 up to about 399. That is in parts per million, which is pretty tiny.

So what can we infer from this data? I'm sure that there are many things to be said, but what I want to consider is that the increase in CO2, that is CO2 being released in to the air, is due to the decomposition and its respiration that is taking place in the soil under that chamber, while it is in the dark. This makes sense because the plants in the chamber would not be carrying out photosynthesis at night.
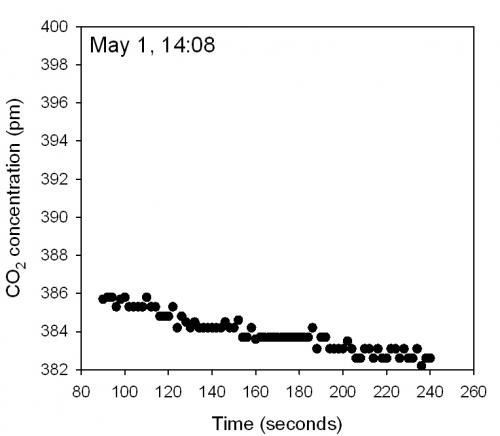
The next graph is from the same chamber, on the same day, taking a measurement in the same way as before. The difference is the time at which this sample was taken. This sample was taken in the daylight hours at 2:08 in the afternoon. The 14:08 represents two hours and eight minutes after 12 o'clock noon. And again we see a very natural pattern if you consider that in the daylight, the photosynthesis being carried on in the plants, and taking in CO2, are working more than the decomposers. At this time of day in Alaska the sun is just about as high as it's going to get. So, the decrease from about 386 to about 382 parts per million falls in to our area of thinking. It makes sense.

But also look at the shift in the levels of CO2 from graph to graph. The first graph, at nighttime, was already up to over 394 before the sample was taken, as compared to the daytime graph that began at 386. These samples are just 3 minutes each out of a 24-hour day.
In the end, you can see that under natural conditions the tundra, along with most plant filled areas, are carbon sources during the night times and a carbon sink during the daylight hours. This is only for one small area at one particular latitude. How many samples would you need to be sure of what you are seeing? How many areas would you need to measure?
The experimental question is, when the natural setting begins to shift in an un-natural way, influenced by man, how will that carbon balance react? As the global temperatures rise we are looking for shifts in the natural patterns that will change other natural patterns. It's small work that can add up to huge changes for all of us.


Comments