The snow has finally cleared off the research plots!
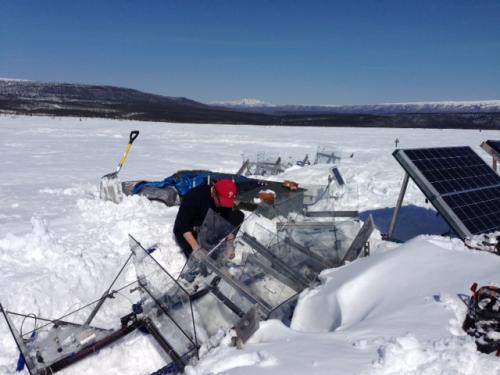
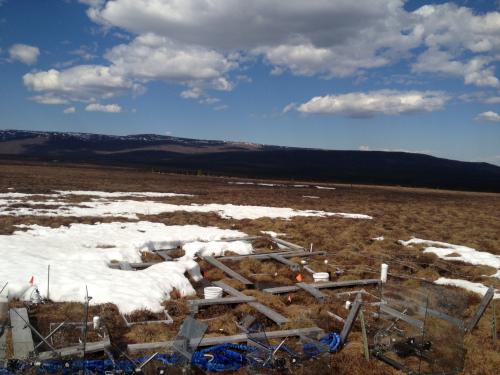

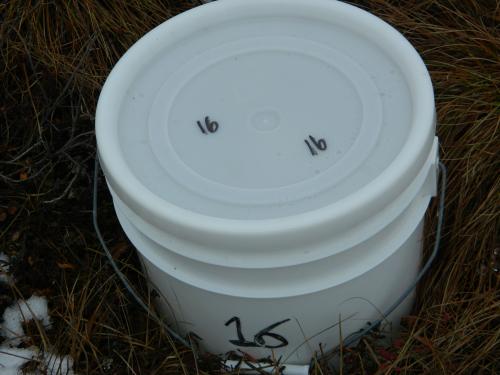
Here’s a picture of one of the winter warming plots. In it you can finally see after being buried in the snow the past six months some of the equipment for the various experiments from which data is collected. The Forced Diffusion Sensors (see journal entry dated April 24), the CO2 collection chambers (see journal entry dated April 8) and the Soda Lime collection buckets (explanation by Elizabeth Webb below).
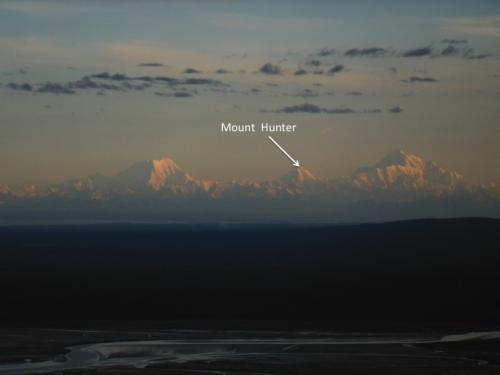
Soda Lime
Our fifth and final way of measuring wintertime ecosystem respiration is the soda lime method. Here’s how it works:
In the fall, we place mason jars full of soda lime (a chemical that adsorbs CO2) on the winter warming and control plots:
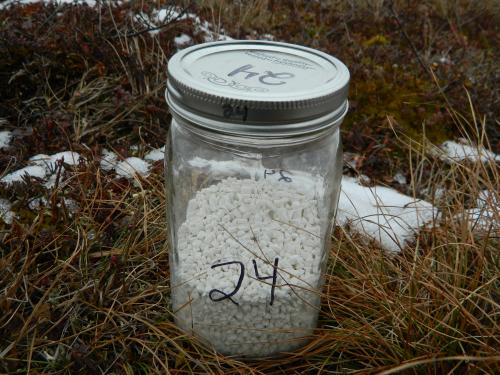
We place the soda lime jars in white 5 gallon buckets, take the cap off the mason jar, put the top on the white bucket, and then let it sit for the whole winter. It ends up looking like this:
Over the winter the soda lime adsorbs the CO2 being produced by soil. Then in the spring, we remove the mason jars, dry the soda lime, and weigh it in the lab. The soda lime at the end of the winter has more mass than at the beginning of the winter because it has adsorbed CO2. We can tell the amount of CO2 that was produced over the winter by the increase in soda lime mass.
The advantage of this method is that it is easy. There are no wires to break or batteries to fail. All you have to do is place the soda lime on the plots in the fall and return in the spring. It is also relatively inexpensive. So why are we investing so much time and energy in the other methods? Well the downside of the soda lime method is that we can’t look at the drivers of wintertime respiration. In other words, we can’t say at x temperature and y snow depth, we expect z grams of carbon to be released. The soda lime method only gives us one estimate for the entire winter. That’s what I’m trying to determine using the other methods, because they give us estimates on a much smaller time scale.
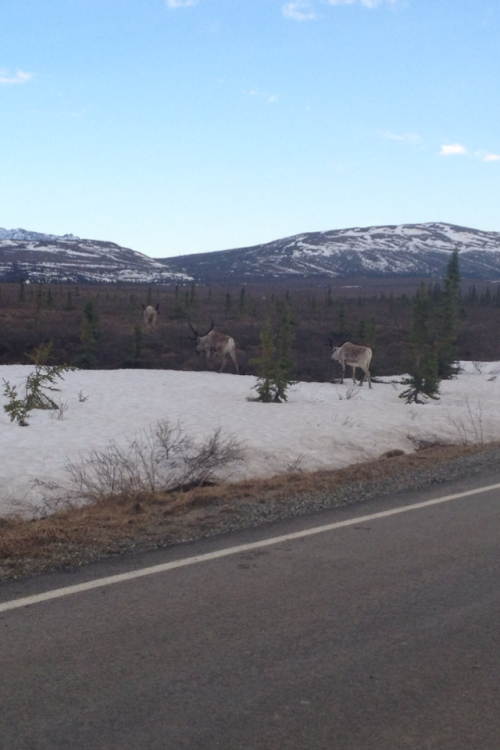
There were several questions regarding animals seen at the CiPEHR Site. Here's a view of some spotted on the way to the research site last week.
- < prev
- 29 of 29


Comments